Dr. Reddy’s Q4 & FY23 Financial Results
2023-05-10
财报生物类似药上市批准
Preview
来源: Business Wire
Preview
来源: Business Wire

Preview
来源: Business Wire
HYDERABAD, India--(BUSINESS WIRE)--Dr. Reddy’s Laboratories Ltd. (BSE: 500124 | NSE: DRREDDY | NYSE: RDY | NSEIFSC: DRREDDY) today announced its consolidated financial results for the fourth quarter and full year ended March 31, 2023. The information mentioned in this release is on the basis of consolidated financial statements under International Financial Reporting Standards (IFRS).
Q4 Performance Summary
FY23 Performance Summary
Rs. 6,297 Cr
Rs. 24,588 Cr
Revenue
Revenue
[Up: 16% YoY; Down 7% QoQ]
[Up: 15% YoY]
57.2%
56.7%
Gross Margin
Gross Margin
[Q4 FY22: 52.9%; Q3 FY23: 59.2%]
[FY22: 53.1%]
Rs. 1,799 Cr
Rs. 6,803 Cr
SGNA expenses
SGNA expenses
[28.6% of Revenues]
[27.7% of Revenues]
Rs. 537 Cr
Rs. 1,938 Cr
R&D expenses
R&D expenses
[8.5% of Revenues]
[7.9% of Revenues]
Rs. 1,631 Cr
Rs. 7,308 Cr
EBITDA
EBITDA
[25.9% of Revenues; Up: 26% YoY; Down: 17% QoQ]
[29.7% of Revenues; Up: 42% YoY]
Rs. 1,326 Cr*
Rs. 6,037 Cr*
Profit before Tax
Profit before Tax
[Up: 434% YoY; Down: 19% QoQ]
[Up: 87% YoY]
Rs. 959 Cr
Rs. 4,507 Cr
Profit after Tax
Profit after Tax
[Up: 996% YoY; Down: 23% QoQ]
[Up: 91% YoY]
* Excluding impairments in current & previous periods, Q4 FY 23 PBT is Rs. 1,380 Cr (growth of 38% YoY) and FY 23 PBT is Rs. 6,107 Cr (growth of 53% YoY)
Commenting on the results, Co-Chairman & MD, G V Prasad said: “FY 23 has been a year of record sales, profits and cash flow, driven by our performance in US Generics. We progressed well in our productivity and sustainability agenda. We will continue to deliver on our purpose, invest in growth drivers and promote a culture that is innovative and collaborative ensuring the future of our business.”
All amounts in millions, except EPS. All US dollar amounts based on convenience translation rate of 1 USD = Rs. 82.19
Dr. Reddy’s Laboratories Limited and Subsidiaries
Consolidated Income Statement
Particulars
Q4 FY23
Q4 FY22
YoY
Gr %
Q3 FY23
QoQ
Gr%
($)
(Rs.)
($)
(Rs.)
($)
(Rs.)
Revenues
766
62,968
661
54,368
16
824
67,700
(7)
Cost of Revenues
328
26,971
312
25,625
5
336
27,607
(2)
Gross Profit
438
35,997
350
28,743
25
488
40,093
(10)
Operating Expenses
Selling, General & Administrative expenses
219
17,992
191
15,674
15
219
17,981
0
Research and Development expenses
65
5,366
53
4,326
24
59
4,821
11
Impairment of non-current assets
7
540
91
7,515
(93)
2
134
303
Other operating (income)/expense
(3)
(281)
(4)
(291)
(3)
9
732
(138)
Results from operating activities
151
12,380
18
1,519
715
200
16,425
(25)
Net finance (income)/expense
(10)
(799)
(10)
(859)
(7)
2
139
(675)
Share of profit of equity accounted investees
(1)
(76)
(1)
(105)
(28)
(1)
(60)
27
Profit before income tax
161
13,255
30
2,483
434
199
16,346
(19)
Income tax expense
45
3,663
20
1,608
128
47
3,875
(5)
Profit for the period
117
9,592
11
875
996
152
12,471
(23)
Diluted Earnings Per Share (EPS)
0.70
57.62
0.06
5.26
995
0.91
74.95
(23)
As % to revenues
Q4 FY23
Q4 FY22
Q3 FY23
Gross Profit
57.2
52.9
59.2
28.6
28.8
26.6
R&D
8.5
8.0
7.1
EBITDA
25.9
23.9
29.0
PBT
21.1
4.6
24.1
PAT
15.2
1.6
18.4
EBITDA Computation
Particulars
Q4 FY23
Q4 FY22
Q3 FY23
($)
(Rs.)
($)
(Rs.)
($)
(Rs.)
Profit before Income Tax
161
13,255
30
2,483
199
16,346
Interest (income) / expense - Net*
(8)
(673)
0
24
(1)
(93)
Depreciation
27
2,213
25
2,039
27
2,245
Amortization
12
977
11
920
12
1,026
Impairment
7
540
91
7,515
2
134
EBITDA
198
16,312
158
12,980
239
19,658
* Includes income from Investments
All amounts in millions, except EPS. All US dollar amounts based on convenience translation rate of 1 USD = Rs. 82.19
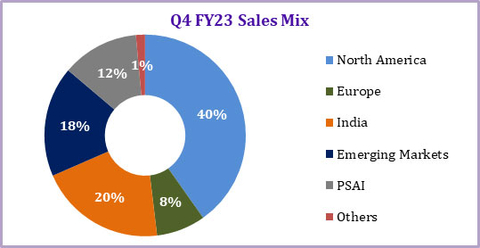
Revenue Mix by Segment
Segment
Q4 FY23
Q4 FY22
YoY
Gr %
Q3 FY23
QoQ
Gr %
(Rs.)
(Rs.)
(Rs.)
Global Generics
54,257
46,118
18
59,241
(8)
North America
25,321
19,971
27
30,567
(17)
Europe
4,960
4,444
12
4,303
15
India
12,834
9,689
32
11,274
14
Emerging Markets
11,142
12,013
(7)
13,097
(15)
Pharmaceutical Services and Active Ingredients (PSAI)
7,787
7,557
3
7,758
0
Others
924
693
33
701
32
Total
62,968
54,368
16
67,700
(7)
All amounts in millions, except EPS. All US dollar amounts based on convenience translation rate of 1 USD = Rs. 82.19
Dr. Reddy’s Laboratories Limited and Subsidiaries
Consolidated Income Statement
Particulars
FY23
FY22
Gr
%
($)
(Rs.)
%
($)
(Rs.)
%
Revenue
2,992
2,45,879
100.0
2,608
2,14,391
100.0
15
Cost of revenues
1,296
1,06,536
43.3
1,223
1,00,551
46.9
6
Gross profit
1,695
1,39,343
56.7
1,385
1,13,840
53.1
22
Operating Expenses
Selling, General & Administrative expenses
828
68,026
27.7
755
62,081
29.0
10
Research and Development expenses
236
19,381
7.9
213
17,482
8.2
11
Impairment of non-current assets
9
699
0.3
92
7,562
3.5
(91)
Other operating income
(72)
(5,907)
(2.4)
(34)
(2,761)
(1.3)
114
Results from operating activities
695
57,144
23.2
359
29,476
13.7
94
Net finance income
(35)
(2,853)
(1.2)
(26)
(2,119)
(1.0)
35
Share of profit of equity accounted investees
(5)
(370)
(0.2)
(9)
(703)
(0.3)
(47)
Profit before income tax
734
60,367
24.6
393
32,298
15.1
87
Income tax expense
186
15,300
6.2
106
8,730
4.1
75
Profit for the period
548
45,067
18.3
287
23,568
11.0
91
Diluted EPS
3.30
270.85
1.72
141.69
91
EBITDA Computation
Particulars
FY23
FY22
($)
(Rs.)
($)
(Rs.)
Profit before Income Tax
734
60,367
393
32,298
Interest income - Net*
(8)
(621)
(3)
(284)
Depreciation
105
8,614
99
8,152
Amortization
49
4,022
45
3,672
Impairment
9
699
92
7,562
EBITDA
889
73,081
625
51,400
* Includes income from Investments
Key Balance Sheet Items
Particulars
As on 31st Mar 2023
As on 31st Dec 2022
As on 31st Mar 2022
($)
(Rs.)
($)
(Rs.)
($)
(Rs.)
Cash and cash equivalents and other investments
760
62,456
610
50,164
584
48,033
Trade receivables (current & non-current)
882
72,486
913
75,046
813
66,818
Inventories
592
48,670
600
49,326
619
50,884
Property, plant and equipment
809
66,462
791
64,996
756
62,169
Goodwill and Other Intangible assets
427
35,094
431
35,401
385
31,664
Loans and borrowings (current & non-current)
164
13,472
215
17,663
412
33,845
Trade payables
322
26,444
317
26,023
311
25,572
Equity
2,810
2,30,991
2,680
2,20,273
2,318
1,90,527
All amounts in millions, except EPS. All US dollar amounts based on convenience translation rate of 1 USD = Rs. 82.19
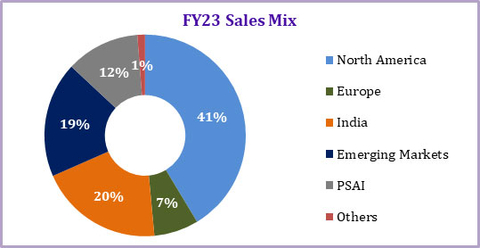
Revenue Mix by Segment [year on year]
Segment
FY23
FY22
Gr
%
($)
(Rs.)
%
($)
(Rs.)
%
Global Generics
2,601
2,13,768
86.9%
2,180
1,79,170
83.6%
19%
North America
1,237
1,01,704
41.4%
911
74,915
34.9%
36%
Europe
214
17,603
7.2%
202
16,631
7.8%
6%
India
595
48,932
19.9%
510
41,957
19.6%
17%
Emerging Markets
554
45,529
18.5%
556
45,667
21.3%
0%
Pharmaceutical Services and Active Ingredients (PSAI)
354
29,069
11.8%
374
30,740
14.3%
-5%
Others
37
3,042
1.2%
55
4,481
2.1%
-32%
Total
2,992
2,45,879
100.0%
2,608
2,14,391
100.0%
15%
Revenue Analysis [Q4 FY23 and FY23]
Global Generics (GG)
FY23 revenue for GG segment at Rs. 213.8 billion higher by 19% over FY22. This growth was driven by North America, Europe and India, while Emerging markets remained flat.
Q4 revenue at Rs. 54.3 billion, YoY growth of 18% and QoQ decline of 8%. YoY growth was driven by growth in North America, Europe and India markets; however, partially impacted due to a decline in revenues in Emerging Markets. QoQ decline was mainly due to decline in North America and Emerging Markets, partially offset by growth in Europe and India
North America
FY23 revenue from North America Generics for the year at Rs. 101.7 billion, YoY growth of 36%. The growth was contributed by new launches, scale up of existing products and favorable forex rates movement, which was partially offset by price erosion.
Q4 revenue at Rs. 25.3 billion, YoY growth of 27% and QoQ decline of 17%. YoY growth was primarily on account of new product launches and favorable forex rates movement, partly offset by price erosion. QoQ decline was due to fluctuation in demand for our new launches.
During the quarter, we launched 6 new products – Difluprednate, Lurasidone Tablets, Lubiprostone Capsules, Sunitinib Capsules, Nelarabine Injection and Timolol Gel. This takes our full year launch count to 25 products.
During the year, we filed 12 new Abbreviated New Drug Applications (ANDAs) with the US Food and Drug Administration (USFDA). As of 31st March 2023, cumulatively 86 generic filings are pending for approval with the USFDA (81 ANDAs and 5 NDAs under 505(b)(2) route). Out of the pending 86 ANDAs, 45 are Para IVs, and we believe 18 have ‘First to File’ status.
Europe
FY23 revenue from Europe at Rs. 17.6 billion. YoY growth of 6%, driven by volume traction in base business and new product launches, which was partially offset by price erosion in some of our products.
Q4 revenue at Rs. 5.0 billion, YoY growth of 12% and QoQ growth of 15%. YoY growth was primarily on account of new product launches and traction in base business volumes, partly offset by price erosion in the base business. QoQ growth was driven by traction in base business volumes and favourable forex rates movement.
India
FY23 revenue from India at Rs. 48.9 billion. YoY growth of 17% was primarily attributable to increase in prices of our existing products, along with additional revenues from the launch of new products. The growth was also aided by divestment of a few non-core brands during the year. During the year, we launched 9 new brands in India.
Q4 revenue at Rs. 12.8 billion, YoY growth of 32% and QoQ growth of 14%. YoY growth primarily driven by favorable price variance, new product launches, and non-core brand divestments while QoQ growth was primarily due to divestment of a few non-core brands, partially offset by decline in volumes of some of our products.
Emerging Markets
FY23 revenue from Emerging Markets at Rs. 45.5 billion, remained flat over the previous year. However, this grew by 13% adjusted for the covid related product sales and divestment income realized in the last year.
Revenue from Russia for the year at Rs. 21.2 billion, YoY growth of 2% impacted due to higher base of FY 22, which included revenues from divestment of few non-core brands. The base business grew by 11% net of divestment income, driven by favorable price variance and beneficial forex rates movement, partially offset by a decrease in volumes.
Revenue from other CIS countries and Romania for the year at Rs. 8.6 billion, YoY growth of 4%. Growth was on account of favorable price variance, partly offset by a decrease in volumes of base business and adverse movement in forex rates.
Revenue from Rest of World (RoW) territories for the year at Rs. 15.7 billion, YoY decline of 5% primarily on account of revenues from covid related products in the FY 22. The revenues were also impacted by an adverse price variance, partly offset by new product launches.
Q4 revenue at Rs. 11.1 billion, YoY decline of 7% and QoQ decline of 15%.
Revenue for Russia for Q4 at Rs. 5.2 billion, both YoY and QoQ decline of 24%. YoY decline was mainly attributable to divestment income & higher channel inventory in Q4 of last year. QoQ decline was primarily due to reduction in base business volumes and adverse forex rates movement.
Revenue from other CIS countries and Romania for the quarter are Rs. 2.3 billion, remained flat YoY while showing an increase of 2% QoQ. Benefits from favorable price variance were set off with reduction in base business volumes.
Revenue from Rest of World (RoW) territories for Q4 at Rs. 3.7 billion, YoY growth of 28% and QoQ decline of 8%. The YoY growth was primarily driven by an increase in base business volumes, new product launches and favorable forex rates movement, partially offset by adverse price variance. QoQ decline was mainly due to adverse price variance and reduction in base business volumes.
Pharmaceutical Services and Active Ingredients (PSAI)
FY23 revenue from PSAI at Rs. 29.1 billion. YoY decline of 5%. The decline was mainly on account of decline in base business volumes and price erosion in some of our products, partially offset by new product launches and favorable forex rate movements. FY22 included higher contribution from sales of covid related portfolio.
Q4 revenue at Rs. 7.8 billion, with growth of 3% YoY, while it remained flat QoQ. YoY growth was primarily driven by new product launches and favourable forex rates movement. These were offset by a reduction in base business volumes and adverse price variance.
During the year, we have filed 12 DMFs in the US, of which 7 DMFs were filed in Q4FY23.
Income Statement Highlights:
FY 23 gross margin at 56.7%, an increase of ~360 bps over previous year. The increase was driven by new product sales of certain products with higher gross margins, higher government incentives and favourable foreign exchange. This was partially offset with price erosion in certain of our products, primarily in the United States and Europe. The gross profit margin for GG and PSAI business segments are at 62.1% and 16.2% respectively.
Q4 gross margin at 57.2% (GG: 61.7%, PSAI: 25.2%). Gross margin increased by ~430 bps YoY, while it declined by ~210 bps QoQ. YoY increase was driven by new product sales of certain products with higher gross margins, and favourable foreign exchange, partially offset by price erosion, primarily in United States and Europe. QoQ decline was primarily due to lower government incentives and product mix, which was partly offset by income from divestment of non-core brands.
Selling, general & administrative (SG&A) expenses for FY23 at Rs. 68.0 billion, an increase of 10% on a YoY basis. SG&A as a % to sales for FY23 was 27.7%, a decline of 130 basis points over FY22. SG&A expenses for Q4 at Rs. 18.0 billion, YoY increase of 15% and remained flat QoQ. The SG&A spend increase is largely on account of investments in sales & marketing and adverse impact of forex rates.
Impairment charge for FY23 at Rs. 0.7 billion and for Q4 at Rs. 0.5 billion. This is mainly due to decrease in market potential of products acquired from Nimbus Health GmbH and certain other product-related intangibles due to adverse market conditions.
Research & development (R&D) expenses in FY23 at Rs. 19.4 billion. As % to Revenues – FY23: 7.9% | FY22: 8.2%. Q4 R&D expenses at Rs. 5.4 billion, 8.5% of revenue. We continue our focus on investing in R&D to build a healthy pipeline of new products across our markets for both small molecules and biosimilars.
Other operating income for FY23 at Rs. 5.9 billion compared to Rs. 2.8 billion in FY22. The net other income was higher primarily on account of recognition of income of Rs. 5.6 billion from a settlement agreement, with Indivior Inc., Indivior UK Limited, and Aquestive Therapeutics, Inc., resolving all claims between the parties relating to the Company’s generic buprenorphine and naloxone sublingual film. Other operating income for Q4 was Rs. 0.3 billion.
Net Finance income for FY23 at Rs. 2.9 billion compared to Rs. 2.1 billion in FY22. The increase is primarily on account of higher foreign exchange gain in current year as compared to FY22 and increase in profit on sale of mutual funds compared to FY22. Net finance income in Q4 was Rs. 0.8 billion.
Profit before Tax for FY23 at Rs. 60.4 billion, YoY growth of 87%. Profit before Tax for Q4 is at Rs. 13.3 billion.
Profit after Tax for FY23 at Rs. 45.1 billion and for Q4 at Rs. 9.6 billion. The effective tax rate for the year has been 25.3% as compared to 27.0% in FY22, due to changes in the Company’s jurisdictional mix of earnings. The effective tax rate for the quarter has been at 27.6% as compared to 64.8% in Q4FY22. The previous year ETR was higher due to impairment charge impact.
Diluted earnings per share for FY23 is Rs. 270.9. Diluted earnings per share for Q4 is Rs. 57.6.
Other Highlights:
EBITDA for FY23 at Rs. 73.1 billion and the EBITDA margin is 29.7%. EBITDA for Q4 at 16.3 billion and the EBITDA margin at 25.9%.
Capital expenditure for FY23 at Rs. 11.3 billion. Capital expenditure for Q4 at Rs. 2.6 billion.
Free cash-flow for FY23 at Rs. 40.1 billion and for Q4 it at Rs. 16.0 billion.
Net cash surplus for the company at Rs. 50.5 billion as on March 31, 2023.
The Board has recommended payment of a dividend of Rs. 40 per equity share of face value Rs 5/- each (800% of face value) for the year ended March 31, 2023 subject to approval of the members of the company.
All amounts in millions, except EPS
About key metrics and non-GAAP Financial Measures
This press release contains non-GAAP financial measures within the meaning of Regulation G and Item 10(e) of Regulation S-K. Such non-GAAP financial measures are measures of our historical performance, financial position or cash flows that are adjusted to exclude or include amounts, as the case may be, from the most directly comparable financial measure calculated and presented in accordance with IFRS.
The presentation of this financial information is not intended to be considered in isolation or as a substitute for, or superior to, the financial information prepared and presented in accordance with IFRS. Our non-GAAP financial measures are not based on any comprehensive set of accounting rules or principles. These measures may be different from non-GAAP financial measures used by other companies, limiting their usefulness for comparison purposes.
We believe these non-GAAP financial measures provide investors with useful supplemental information about the financial performance of our business, enable comparison of financial results between periods where certain items may vary independent of business performance, and allow for greater transparency with respect to key metrics used by management in operating our business.
For more information on our non-GAAP financial measures and a reconciliation of GAAP to non-GAAP measures, please refer to "Reconciliation of GAAP to Non-GAAP Results" table in this press release.
All amounts in millions, except EPS
Reconciliation of GAAP measures to Non-GAAP measures
Free Cash Flow
Three months Ended March 31, 2023
Year Ended
March 31, 2023
Net cash generated from operating activities
23,376
69,587
Less:
Taxes
(3,697)
(10,714)
Investments in PPE and Intangibles
(3,722)
(18,782)
Free Cash Flow
15,957
40,091
Operating working capital
Year Ended
March 31, 2023
Inventories
48,670
Trade Receivables
72,485
Less:
Trade Payables
26,444
Operating Working Capital
94,711
Net cash surplus
Year Ended
March 31, 2023
Cash and cash equivalents
5,779
Investments
56,678
Short-term borrowings
(7,390)
Long-term borrowings, current portion
(4,804)
Less:
Restricted cash balance
89
Lease liabilities (included in Long-term
borrowings, current portion)
(1,004)
Equity Investments
(included in Investments)
716
Net Cash Surplus
50,462
All amounts in millions, except EPS
Computation of Return on Capital Employed
Year Ended
March 31, 2023
Profit before tax
60,367
Less:
Interest and Investment Income
(Excluding forex gain/loss)
627
Earnings Before Interest and taxes [A]
59,740
Average Capital Employed [B]
1,72,602
Return on Capital Employed (A/B) (Ratio)
34.6%
Computation of capital employed
Year Ended
March 31, 2023
Year Ended
March 31, 2022
Property Plant and Equipment
66,462
62,169
Intangibles
30,849
27,246
Goodwill
4,245
4,418
Investment in equity accounted associates
4,702
4,318
Other Current Assets
20,069
13,902
Other investments
660
3,668
Other non-current assets
800
894
Inventories
48,670
50,884
Trade Receivables
72,485
66,818
Derivative Financial Instruments
1,095
1,427
Less:
Other Liabilities
42,320
36,414
Provisions
5,513
4,315
Trade payables
26,444
25,572
Operating Capital Employed
1,75,760
1,69,443
Average Capital Employed
1,72,602
Computation of EBITDA
Refer page no. 2 and 4 for EBITDA computations.
Earnings Call Details (07:30 pm IST, 10:00 am EDT, May 10, 2023)
The management of the Company will host an earnings call to discuss the Company’s financial performance and answer any questions from the participants.
Conference Joining Information
Option 1: Express Join with DiamondPass™
Pre-register with the below link and join without waiting for the operator.
https://services.choruscall.in/DiamondPassRegistration/register?confirmationNumber=8728481&linkSecurityString=2cca7c8d18
Option 2: Join through below Dial-In Numbers
Universal Access Number:
+91 22 6280 1219
+91 22 7115 8120
International Toll Free Number:
USA: 1 866 746 2133
UK: 0 808 101 1573
Singapore: 800 101 2045
Hong Kong: 800 964 448
No password/pin number is necessary to dial in to any of the above numbers. The operator will provide instructions on asking questions before and during the call.
Play Back: The play back will be available after the earnings call, till May 17th, 2023. For play back dial in phone No: +91 22 7194 5757, and Playback Code is 65827.
Transcript: Transcript of the Earnings call will be available on the Company’s website: www.drreddys.com
About Dr. Reddy’s: Dr. Reddy’s Laboratories Ltd. (BSE: 500124, NSE: DRREDDY, NYSE: RDY, NSEIFSC: DRREDDY) is an integrated pharmaceutical company, committed to providing affordable and innovative medicines for healthier lives. Through its businesses, Dr. Reddy’s offers a portfolio of products and services including APIs, custom pharmaceutical services, generics, biosimilars and differentiated formulations. Our major therapeutic areas of focus are gastrointestinal, cardiovascular, diabetology, oncology, pain management and dermatology. Dr Reddy’s operates in markets across the globe. Our Major markets include – USA, India, Russia & CIS countries, and Europe. For more information, log on to: www.drreddys.com
Disclaimer: This press release may include statements of future expectations and other forward-looking statements that are based on the management’s current views and assumptions and involve known or unknown risks and uncertainties that could cause actual results, performance or events to differ materially from those expressed or implied in such statements. In addition to statements which are forward-looking by reason of context, the words "may", "will", "should", "expects", "plans", "intends", "anticipates", "believes", "estimates", "predicts", "potential", or "continue" and similar expressions identify forward-looking statements. Actual results, performance or events may differ materially from those in such statements due to without limitation, (i) general economic conditions such as performance of financial markets, credit defaults , currency exchange rates , interest rates, persistency levels and frequency / severity of insured loss events (ii) mortality and morbidity levels and trends, (iii) changing levels of competition and general competitive factors, (iv) changes in laws and regulations and in the policies of central banks and/or governments, (v) the impact of acquisitions or reorganization, including related integration issues, (vi) the susceptibility of our industry and the markets addressed by our, and our customers’, products and services to economic downturns as a result of natural disasters, epidemics, pandemics or other widespread illness, including coronavirus (or COVID-19), and (vii) other risks and uncertainties identified in our public filings with the Securities and Exchange Commission, including those listed under the "Risk Factors" and "Forward-Looking Statements" sections of our Annual Report on Form 20-F for the year ended March 31, 2022. The company assumes no obligation to update any information contained herein.”
更多内容,请访问原始网站
文中所述内容并不反映新药情报库及其所属公司任何意见及观点,如有版权侵扰或错误之处,请及时联系我们,我们会在24小时内配合处理。
靶点
-热门报告


立即开始免费试用!
智慧芽新药情报库是智慧芽专为生命科学人士构建的基于AI的创新药情报平台,助您全方位提升您的研发与决策效率。
立即开始数据试用!
智慧芽新药库数据也通过智慧芽数据服务平台,以API或者数据包形式对外开放,助您更加充分利用智慧芽新药情报信息。