Fallopian Tube Cancer Therapeutics Market Size to Grow by USD 628.28 million | 39% of Market Growth to Originate from North America | Technavio
2022-06-13
基因疗法
NEW YORK, June 13, 2022 /PRNewswire/ -- Fallopian tube cancer, also known as tubal cancer, is a type of cancer that is caused by an abnormal cell division in the fallopian tubes that connect to the ovaries and the uterus. It is a less common type of gynecologic cancer.
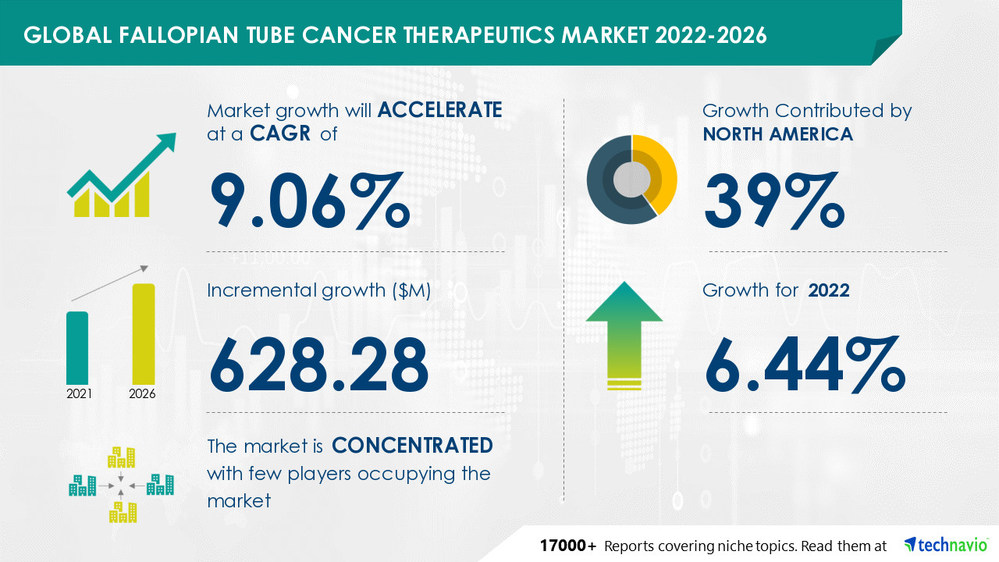
The fallopian tube cancer therapeutics market size is expected to grow by USD 628.28 mn from 2021 to 2026. Moreover, the growth momentum of the market will accelerate at a CAGR of 9.06% during the forecast period.
Preview
来源: PRNewswire
Technavio has announced its latest market research report titled Fallopian Tube Cancer Therapeutics Market by Product and Geography - Forecast and Analysis 2022-2026
Download an Exclusive Sample Report
to learn more about market growth
Top Key players in Fallopian Tube Cancer Therapeutics Market
Amgen Inc. - The company offers fallopian tube cancer therapeutics, namely Trebananib.
Baxter International Inc. - The company offers fallopian tube cancer therapeutics, namely Doxil.
Bristol Myers Squibb Co. - The company offers fallopian tube cancer therapeutics, namely Opdivo.
Clovis Oncology Inc. - The company offers fallopian tube cancer therapeutics, namely Rucaparib.
Eli Lilly and Co. - The company offers fallopian tube cancer therapeutics, namely Gemzar.
View an Exclusive Sample Report
for a list of other key vendors operating in the market
Market Trend and Challenge
The
growing research on regenerative therapies is driving the market growth. Various institutes and vendors are conducting research on developing novel regenerative therapies, including gene therapy, for the treatment of fallopian tube cancer. This, in turn, will fuel the fallopian tube cancer therapeutics market growth during the forecast period.
Difficulty in diagnosis is challenging the fallopian tube cancer therapeutics market growth. The use of therapeutics may be carried out for long durations, which is a disadvantage for patients with late-stage fallopian tube cancer. This delay in diagnosis is resulting in an increased preference for alternative treatment options, such as surgeries.
Market Segmentation
Fallopian Tube Cancer Therapeutics Market Split by Product
Targeted therapy: This segment will have the highest market share growth during the forecast period. The benefits of targeted therapy will drive the growth of the segment during the forecast period.
Chemotherapy
Fallopian Tube Cancer Therapeutics Market Split by Geography
North America: The region will have the highest market share growth during the forecast period. This growth will be driven by factors such as the increasing adoption of therapeutics for the treatment of the indication. Moreover, market growth in this region will be faster than the growth of the market in other regions.
Europe
Asia
Rest of World (ROW)
Imperative Insights on the following aspects:
What was the size of the global fallopian tube cancer therapeutics industry by value in 2020?
What will be the size of the global fallopian tube cancer therapeutics industry in 2026?
What factors are affecting the strength of competition in the global fallopian tube cancer therapeutics industry?
How has the industry performed over the last five years?
What are the main segments that make up the global fallopian tube cancer therapeutics market?
Get lifetime access to our Technavio Insights! Subscribe to our "Basic Plan" billed annually at USD 5000
Why buy?
Identify growth Strategies across markets
Analyze your competitor market
Know the financial performance of competitors with better insight
Related Reports
Payment Gateways Market by End-user and Geographic Landscape - Forecast and Analysis 2021-2025
Payment Gateways Market by End-user and Geographic Landscape - Forecast and Analysis 2021-2025
Table of Content:
1 Executive Summary
1.1 Market overview
Exhibit 01: Executive Summary – Chart on Market Overview
Exhibit 02: Executive Summary – Data Table on Market Overview
Exhibit 03: Executive Summary – Chart on Global Market Characteristics
Exhibit 04: Executive Summary – Chart on Market by Geography
Exhibit 05: Executive Summary – Chart on Market Segmentation by Product
Exhibit 06: Executive Summary – Chart on Incremental Growth
Exhibit 07: Executive Summary – Data Table on Incremental Growth
Exhibit 08: Executive Summary – Chart on Vendor Market Positioning
2 Market Landscape
2.1 Market ecosystem
Exhibit 09: Parent market
Exhibit 10: Market Characteristics
3 Market Sizing
3.1 Market definition
Exhibit 11: Offerings of vendors included in the market definition
3.2 Market segment analysis
Exhibit 12: Market segments
3.3 Market size 2021
3.4 Market outlook: Forecast for 2021-2026
Exhibit 13: Chart on Global - Market size and forecast 2021-2026 ($ million)
Exhibit 14: Data Table on Global - Market size and forecast 2021-2026 ($ million)
Exhibit 15: Chart on Global Market: Year-over-year growth 2021-2026 (%)
Exhibit 16: Data Table on Global Market: Year-over-year growth 2021-2026 (%)
4 Five Forces Analysis
4.1 Five forces summary
Exhibit 17: Five forces analysis - Comparison between 2021 and 2026
4.2 Bargaining power of buyers
Exhibit 18: Chart on Bargaining power of buyers – Impact of key factors 2021 and 2026
4.3 Bargaining power of suppliers
Exhibit 19: Bargaining power of suppliers – Impact of key factors in 2021 and 2026
4.4 Threat of new entrants
Exhibit 20: Threat of new entrants – Impact of key factors in 2021 and 2026
4.5 Threat of substitutes
Exhibit 21: Threat of substitutes – Impact of key factors in 2021 and 2026
4.6 Threat of rivalry
Exhibit 22: Threat of rivalry – Impact of key factors in 2021 and 2026
4.7 Market condition
Exhibit 23: Chart on Market condition - Five forces 2021 and 2026
5 Market Segmentation by Product
5.1 Market segments
Exhibit 24: Chart on Product - Market share 2021-2026 (%)
Exhibit 25: Data Table on Product - Market share 2021-2026 (%)
5.2 Comparison by Product
Exhibit 26: Chart on Comparison by Product
Exhibit 27: Data Table on Comparison by Product
5.3 Targeted therapy - Market size and forecast 2021-2026
Exhibit 28: Chart on Targeted therapy - Market size and forecast 2021-2026 ($ million)
Exhibit 29: Data Table on Targeted therapy - Market size and forecast 2021-2026 ($ million)
Exhibit 30: Chart on Targeted therapy - Year-over-year growth 2021-2026 (%)
Exhibit 31: Data Table on Targeted therapy - Year-over-year growth 2021-2026 (%)
5.4 Chemotherapy - Market size and forecast 2021-2026
Exhibit 32: Chart on Chemotherapy - Market size and forecast 2021-2026 ($ million)
Exhibit 33: Data Table on Chemotherapy - Market size and forecast 2021-2026 ($ million)
Exhibit 34: Chart on Chemotherapy - Year-over-year growth 2021-2026 (%)
Exhibit 35: Data Table on Chemotherapy - Year-over-year growth 2021-2026 (%)
5.5 Market opportunity by Product
Exhibit 36: Market opportunity by Product ($ million)
6 Customer Landscape
6.1 Customer landscape overview
Exhibit 37: Analysis of price sensitivity, lifecycle, customer purchase basket, adoption rates, and purchase criteria
7 Geographic Landscape
7.1 Geographic segmentation
Exhibit 38: Chart on Market share by geography 2021-2026 (%)
Exhibit 39: Data Table on Market share by geography 2021-2026 (%)
7.2 Geographic comparison
Exhibit 40: Chart on Geographic comparison
Exhibit 41: Data Table on Geographic comparison
7.3 North America - Market size and forecast 2021-2026
Exhibit 42: Chart on North America - Market size and forecast 2021-2026 ($ million)
Exhibit 43: Data Table on North America - Market size and forecast 2021-2026 ($ million)
Exhibit 44: Chart on North America - Year-over-year growth 2021-2026 (%)
Exhibit 45: Data Table on North America - Year-over-year growth 2021-2026 (%)
7.4 Europe - Market size and forecast 2021-2026
Exhibit 46: Chart on Europe - Market size and forecast 2021-2026 ($ million)
Exhibit 47: Data Table on Europe - Market size and forecast 2021-2026 ($ million)
Exhibit 48: Chart on Europe - Year-over-year growth 2021-2026 (%)
Exhibit 49: Data Table on Europe - Year-over-year growth 2021-2026 (%)
7.5 Asia - Market size and forecast 2021-2026
Exhibit 50: Chart on Asia - Market size and forecast 2021-2026 ($ million)
Exhibit 51: Data Table on Asia - Market size and forecast 2021-2026 ($ million)
Exhibit 52: Chart on Asia - Year-over-year growth 2021-2026 (%)
Exhibit 53: Data Table on Asia - Year-over-year growth 2021-2026 (%)
7.6 Rest of World (ROW) - Market size and forecast 2021-2026
Exhibit 54: Chart on Rest of World (ROW) - Market size and forecast 2021-2026 ($ million)
Exhibit 55: Data Table on Rest of World (ROW) - Market size and forecast 2021-2026 ($ million)
Exhibit 56: Chart on Rest of World (ROW) - Year-over-year growth 2021-2026 (%)
Exhibit 57: Data Table on Rest of World (ROW) - Year-over-year growth 2021-2026 (%)
7.7 US - Market size and forecast 2021-2026
Exhibit 58: Chart on US - Market size and forecast 2021-2026 ($ million)
Exhibit 59: Data Table on US - Market size and forecast 2021-2026 ($ million)
Exhibit 60: Chart on US - Year-over-year growth 2021-2026 (%)
Exhibit 61: Data Table on US - Year-over-year growth 2021-2026 (%)
7.8 Austria - Market size and forecast 2021-2026
Exhibit 62: Chart on Austria - Market size and forecast 2021-2026 ($ million)
Exhibit 63: Data Table on Austria - Market size and forecast 2021-2026 ($ million)
Exhibit 64: Chart on Austria - Year-over-year growth 2021-2026 (%)
Exhibit 65: Data Table on Austria - Year-over-year growth 2021-2026 (%)
7.9 China - Market size and forecast 2021-2026
Exhibit 66: Chart on China - Market size and forecast 2021-2026 ($ million)
Exhibit 67: Data Table on China - Market size and forecast 2021-2026 ($ million)
Exhibit 68: Chart on China - Year-over-year growth 2021-2026 (%)
Exhibit 69: Data Table on China - Year-over-year growth 2021-2026 (%)
7.10 Switzerland - Market size and forecast 2021-2026
Exhibit 70: Chart on Switzerland - Market size and forecast 2021-2026 ($ million)
Exhibit 71: Data Table on Switzerland - Market size and forecast 2021-2026 ($ million)
Exhibit 72: Chart on Switzerland - Year-over-year growth 2021-2026 (%)
Exhibit 73: Data Table on Switzerland - Year-over-year growth 2021-2026 (%)
7.11 India - Market size and forecast 2021-2026
Exhibit 74: Chart on India - Market size and forecast 2021-2026 ($ million)
Exhibit 75: Data Table on India - Market size and forecast 2021-2026 ($ million)
Exhibit 76: Chart on India - Year-over-year growth 2021-2026 (%)
Exhibit 77: Data Table on India - Year-over-year growth 2021-2026 (%)
7.12 Market opportunity by geography
Exhibit 78: Market opportunity by geography ($ million)
8 Drivers, Challenges, and Trends
8.1 Market drivers
8.2 Market challenges
8.3 Impact of drivers and challenges
Exhibit 79: Impact of drivers and challenges in 2021 and 2026
8.4 Market trends
9 Vendor Landscape
9.1 Overview
9.2 Vendor landscape
Exhibit 80: Overview on Criticality of inputs and Factors of differentiation
9.3 Landscape disruption
Exhibit 81: Overview on factors of disruption
9.4 Industry risks
Exhibit 82: Impact of key risks on business
10 Vendor Analysis
10.1 Vendors covered
Exhibit 83: Vendors covered
10.2 Market positioning of vendors
Exhibit 84: Matrix on vendor position and classification
10.3 Amgen Inc.
Exhibit 85: Amgen Inc. - Overview
Exhibit 86: Amgen Inc. - Product / Service
Exhibit 87: Amgen Inc. - Key offerings
Exhibit 88: Baxter International Inc. - Overview
Exhibit 89: Baxter International Inc. - Business segments
Exhibit 90: Baxter International Inc. - Key news
Exhibit 91: Baxter International Inc. - Key offerings
Exhibit 92: Baxter International Inc. - Segment focus
Exhibit 93: Bristol Myers Squibb Co. - Overview
Exhibit 94: Bristol Myers Squibb Co. - Product / Service
Exhibit 95: Bristol Myers Squibb Co. - Key offerings
10.6 Clovis Oncology Inc.
Exhibit 96: Clovis Oncology Inc. - Overview
Exhibit 97: Clovis Oncology Inc. - Business segments
Exhibit 98: Clovis Oncology Inc. - Key offerings
Exhibit 99: Clovis Oncology Inc. - Segment focus
10.7 Eli Lilly and Co.
Exhibit 100: Eli Lilly and Co. - Overview
Exhibit 101: Eli Lilly and Co. - Product / Service
Exhibit 102: Eli Lilly and Co. - Key offerings
10.8 F. Hoffmann La Roche Ltd.
Exhibit 103: F. Hoffmann La Roche Ltd. - Overview
Exhibit 104: F. Hoffmann La Roche Ltd. - Business segments
Exhibit 105: F. Hoffmann La Roche Ltd. - Key news
Exhibit 106: F. Hoffmann La Roche Ltd. - Key offerings
Exhibit 107: F. Hoffmann La Roche Ltd. - Segment focus
10.9 GlaxoSmithKline Plc
Exhibit 108: GlaxoSmithKline Plc - Overview
Exhibit 109: GlaxoSmithKline Plc - Business segments
Exhibit 110: GlaxoSmithKline Plc - Key news
Exhibit 111: GlaxoSmithKline Plc - Key offerings
Exhibit 112: GlaxoSmithKline Plc - Segment focus
10.10 ImmunoGen Inc.
Exhibit 113: ImmunoGen Inc. - Overview
Exhibit 114: ImmunoGen Inc. - Product / Service
Exhibit 115: ImmunoGen Inc. - Key offerings
10.11 Johnson and Johnson
Exhibit 116: Johnson and Johnson - Overview
Exhibit 117: Johnson and Johnson - Business segments
Exhibit 118: Johnson and Johnson - Key news
Exhibit 119: Johnson and Johnson - Key offerings
Exhibit 120: Johnson and Johnson - Segment focus
10.12 Merck and Co. Inc.
Exhibit 121: Merck and Co. Inc. - Overview
Exhibit 122: Merck and Co. Inc. - Business segments
Exhibit 123: Merck and Co. Inc. - Key news
Exhibit 124: Merck and Co. Inc. - Key offerings
Exhibit 125: Merck and Co. Inc. - Segment focus
11.1 Scope of the report
11.2 Inclusions and exclusions checklist
Exhibit 126: Inclusions checklist
Exhibit 127: Exclusions checklist
11.3 Currency conversion rates for US$
Exhibit 128: Currency conversion rates for US$
11.4 Research methodology
Exhibit 129: Research methodology
Exhibit 130: Validation techniques employed for market sizing
Exhibit 131: Information sources
11.5 List of abbreviations
Exhibit 132: List of abbreviations
About Us
Technavio is a leading global technology research and advisory company. Their research and analysis focus on emerging market trends and provide actionable insights to help businesses identify market opportunities and develop effective strategies to optimize their market positions. With over 500 specialized analysts, Technavio's report library consists of more than 17,000 reports and counting, covering 800 technologies, spanning across 50 countries. Their client base consists of enterprises of all sizes, including more than 100 Fortune 500 companies. This growing client base relies on Technavio's comprehensive coverage, extensive research, and actionable market insights to identify opportunities in existing and potential markets and assess their competitive positions within changing market scenarios.
Contact Us:
Technavio Research
Jesse Maida
US: +1 844 364 1100
UK: +44 203 893 3200
Email: [email protected]
Website: www.technavio.com/
SOURCE Technavio
更多内容,请访问原始网站
文中所述内容并不反映新药情报库及其所属公司任何意见及观点,如有版权侵扰或错误之处,请及时联系我们,我们会在24小时内配合处理。
靶点
-药物
来和芽仔聊天吧


立即开始免费试用!
智慧芽新药情报库是智慧芽专为生命科学人士构建的基于AI的创新药情报平台,助您全方位提升您的研发与决策效率。
立即开始数据试用!
智慧芽新药库数据也通过智慧芽数据服务平台,以API或者数据包形式对外开放,助您更加充分利用智慧芽新药情报信息。