预约演示
更新于:2025-11-05
Cabozantinib (s)-Malate
苹果酸卡博替尼
更新于:2025-11-05
概要
基本信息
药物类型 小分子化药 |
别名 cabozantinib、Cabozantinib Malate、Cabozantinib s-malate (USAN) + [10] |
作用方式 抑制剂、拮抗剂 |
作用机制 AXL抑制剂(AXL受体酪氨酸激酶抑制剂)、RET抑制剂(酪氨酸蛋白激酶受体RET抑制剂)、ROS1抑制剂(原癌基因酪氨酸蛋白激酶ROS抑制剂) |
在研适应症 |
原研机构 |
最高研发阶段批准上市 |
首次获批日期 美国 (2012-11-29), |
最高研发阶段(中国)临床3期 |
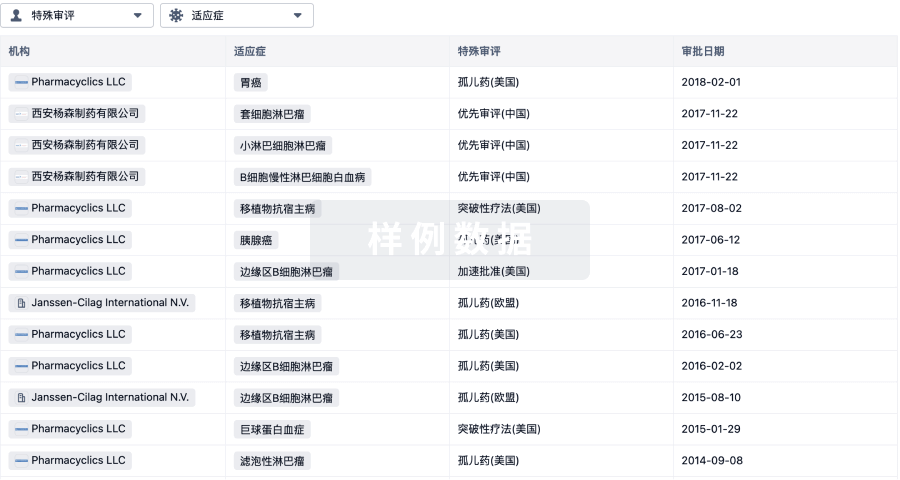
特殊审评优先审评 (美国)、突破性疗法 (美国)、快速通道 (美国)、孤儿药 (美国) |


登录后查看时间轴
结构/序列
分子式C32H30FN3O10 |
InChIKeyHFCFMRYTXDINDK-WNQIDUERSA-N |
CAS号1140909-48-3 |
关联
273
项与 苹果酸卡博替尼 相关的临床试验NCT06900595
A Phase II Study of Cabozantinib in Combination With Cemiplimab (Cabo-Cemiplimab) Versus Cabozantinib Alone in Adolescents and Adults With Advanced Adrenocortical Cancer
NCT07187869
Modulation of the Bone Immune Microenvironment Following Cabozantinib Treatment of Bone Metastatic Clear Cell Renal Cell Carcinoma: Proof of Concept Study

NCT06811116
A Phase I/II Trial of Sapanisertib in Combination With Cabozantinib in β-catenin-mutated Hepatocellular Carcinoma (SAPHIRE)
100 项与 苹果酸卡博替尼 相关的临床结果
登录后查看更多信息
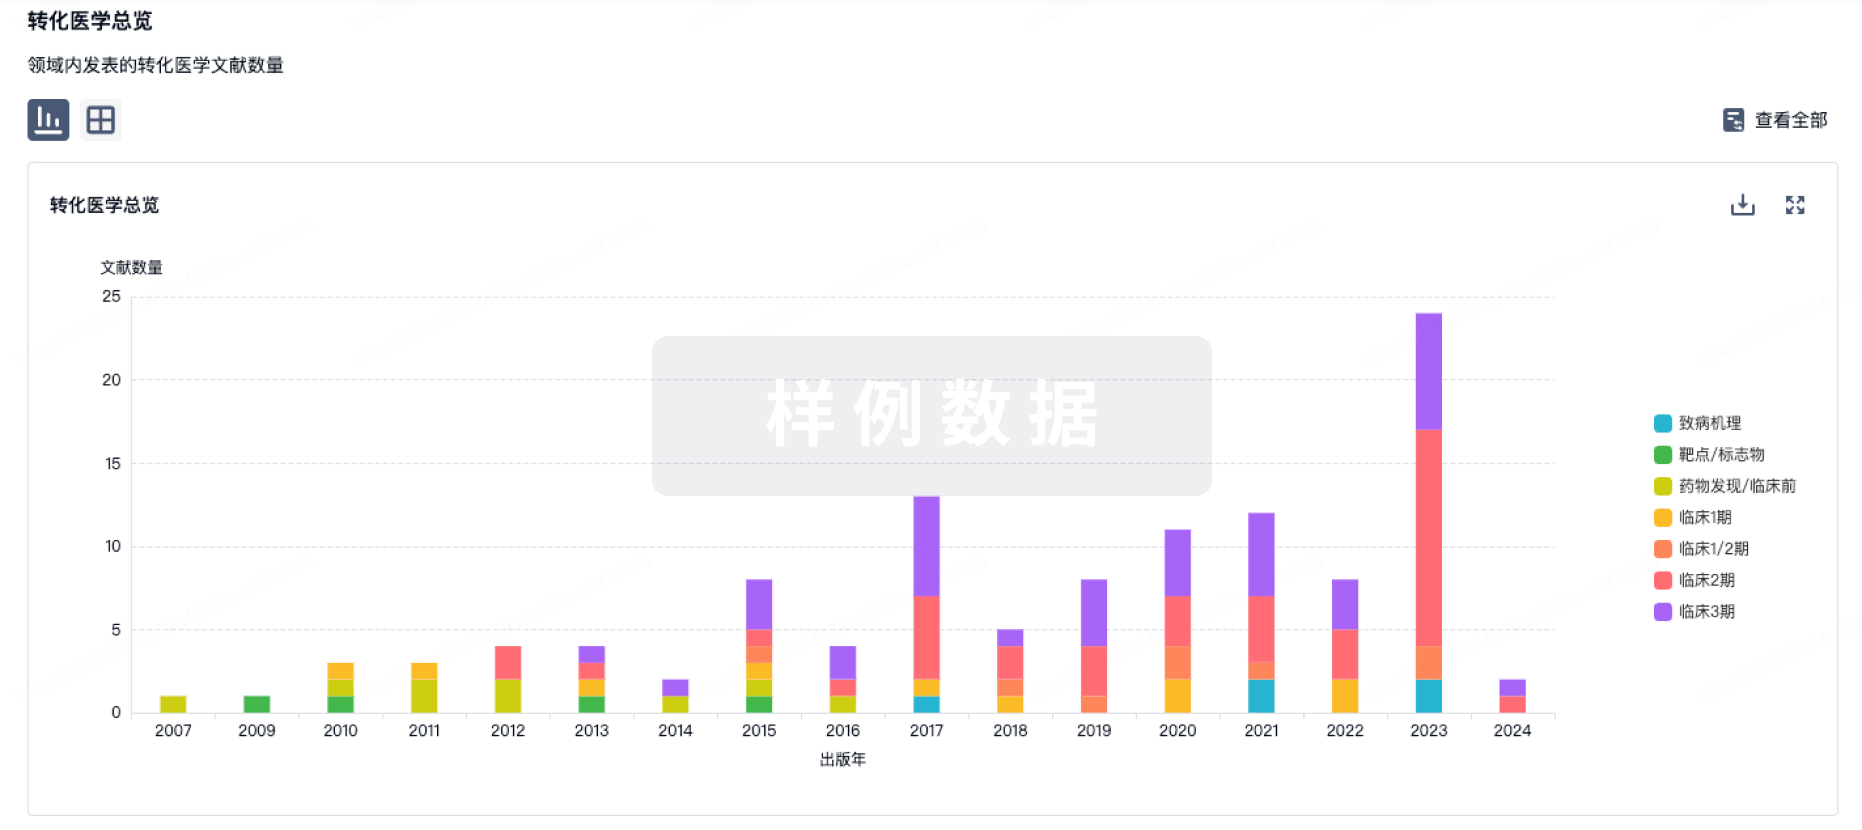
100 项与 苹果酸卡博替尼 相关的转化医学
登录后查看更多信息
100 项与 苹果酸卡博替尼 相关的专利(医药)
登录后查看更多信息
2,492
项与 苹果酸卡博替尼 相关的文献(医药)2025-12-01Medicinal Chemistry
Reducing Cabozantinib Toxicity in Renal Cell Carcinoma Treatment through Structural Modifications
Article
作者: Lu, Yongliang ; Guo, Jiaxiang ; Yang, Yu ; Yin, Xiaotao
Background and Objectives::
Cabozantinib, a Tyrosine Kinase Inhibitor (TKI), is
widely used in Renal Cell Carcinoma (RCC) therapy but often causes serious side effects such as
myelosuppression, immunosuppression, and angiopathy. This study aims to identify key protein
targets responsible for the therapeutic efficacy and adverse reactions of cabozantinib and to explore structural modifications to reduce toxicity while preserving efficacy.
Methods::
A non-randomized computational approach was employed, screening 400 potential
protein targets using SwissTargetPrediction and ChemBL databases. Molecular docking and
Structure-Activity Relationship (SAR) analysis were performed to assess interactions between
cabozantinib and identified targets, focusing on structural elements contributing to toxicity.
Results::
Three primary proteins were identified as responsible for the anti-tumor effects of
cabozantinib, while three others were linked to its side effects. Docking analysis revealed that the
methoxyphenyl group in cabozantinib formed undesirable hydrogen bonds with toxicity-related
proteins. Modulating these off-target interactions by minimizing hydrogen bonding in this region
could significantly reduce adverse effects.
Conclusion::
These findings provide structural insights into cabozantinib’s dual effects and suggest optimization strategies for TKI design, offering a pathway toward safer and more effective
RCC treatments.
2025-12-01Clinical Genitourinary Cancer
CABOSEQ 3—Comparison of Cabozantinib versus Sunitinib Following First-Line Nivolumab- Ipilimumab for Metastatic Renal Cell Carcinoma: A Target Trial Emulation Using Real-World Data from the International Metastatic Renal Cell Carcinoma Database Consortium (IMDC)
Article
作者: Labaki, Chris ; Wells, Connor ; Heng, Daniel Y C ; Szabados, Bernadett ; Yuasa, Takeshi ; Powles, Thomas ; Lemelin, Audreylie ; McKay, Rana R ; Choueiri, Toni K ; Takemura, Kosuke ; Maj, David ; Beuselinck, Benoit ; Brenner, Darren R ; McGregor, Bradley A ; Pal, Sumanta K ; Cheung, Winson Y ; Warkentin, Matthew T ; Boyne, Devon J ; Contreras, Luis Meza ; Ludwig, Lisa
BACKGROUND AND OBJECTIVE:
While the benefit of cabozantinib in metastatic renal cell carcinoma (mRCC) is well established post-tyrosine kinase inhibitor therapy, its comparative effectiveness versus sunitinib after first-line (1L) nivolumab-ipilimumab is uncertain.
METHODS:
A target trial emulation was designed using data from the IMDC to estimate the effect of second-line (2L) cabozantinib versus sunitinib within 18 months of discontinuing 1L nivolumab-ipilimumab on overall survival (OS). Patients diagnosed after January 1, 2017 were followed from initiation of 2L until death or last known contact. Inverse-probability of treatment weighting was used to adjust for hemoglobin, calcium, platelets, and neutrophils at 2L, Karnofsky performance score (KPS) at 2L, time from diagnosis to initiation of 2L, and response to 1L nivolumab-ipilimumab. Treatments were compared using adjusted Kaplan-Meier curves and adjusted hazard ratios (HR) from a Cox regression model. Missing data were addressed with multiple imputation by chained equations. E-values were used to assess the likelihood findings could be explained by residual confounding.
KEY FINDINGS AND LIMITATIONS:
A total of 120 and 121 patients who received cabozantinib or sunitinib after 1L nivolumab-ipilimumab were included. The proportion with a KPS < 80% at 2L (21% vs. 46% P = .001) and the overall response rate to first line therapy (12.7% vs. 17.9% P = .002) differed significantly between cabozantinib and sunitinib. The objective response was 27% for cabozantinib versus 20% for sunitinib with a median time to treatment failure of 8.5 (95% CI: 6.9-12.9) and 4.5 (95% CI: 3.7-5.8) months. Median OS was 21.4 (95% CI: 17.9-NA) months from initiation of cabozantinib and 10.1 (95% CI: 7.6-17.7) months for sunitinib (Adjusted HR 0.44 (95% CI: 0.22-0.86)). The E-value was 2.92, suggesting a low likelihood of findings being due to residual confounding alone.
CONCLUSIONS:
These data provide real-world evidence supporting cabozantinib as a second-line treatment option in mRCC following 1L nivolumab-ipilimumab.
2025-12-01Clinical Genitourinary Cancer
Titrating Cabozantinib in Metastatic Renal Cell Carcinoma Patients Using Goldilocks Principle: A Real-World Evidence Study
Article
作者: Ahrenfeldt, Johanne ; Lyskjær, Iben ; Fristrup, Niels ; Thybo, Malou Aarønæs
INTRODUCTION:
The incidence of renal cell carcinoma (RCC) continues to rise worldwide, and this malignancy has demonstrated substantial sensitivity to both immunotherapies and targeted agents, particularly tyrosine kinase inhibitors (TKIs). Cabozantinib, a commonly utilized TKI, has shown promising efficacy across multiple clinical trials. This study aims to evaluate the real-world effectiveness of individualized cabozantinib dosing as a later-line treatment in patients with metastatic RCC (mRCC).
PATIENTS AND METHODS:
Patients with mRCC treated at the Department of Oncology, Aarhus University Hospital, Denmark, were identified to estimate the median progression free survival (mPFS) and median overall survival (mOS) from treatment initiation. Best radiological response was evaluated using RECIST 1.1. Multivariable cox regression analyses were performed, including covariates such as brain metastasis, first-line treatment, line of treatment, ECOG Performance Status, IMDC risk group, nephrectomy status, and toxicity.
RESULTS:
A total of 179 patients were included, of which 139 patients received second-line (2L) treatment, and 40 patients received third+-line (3+L) treatment. We found a mPFS of 11.2 months for 2L treatment and 11.6 months for 3+L treatment. The mOS was 15.6 months for the 2L group and 17.1 months for the 3+L group. The mPFS and mOS in the IMDC favourable risk group were 28.5 and 52.1 months, respectively. No significant differences in mPFS or mOS were observed based on prior 1L treatment or the presence of brain metastases. The mOS and mPFS found in this study are comparable to, and in some cases exceed, those reported in other real-world cohorts. Interestingly, we found treatment-related toxicity to correlate significantly with an increased survival (mOS 66.8 vs. 32.8 months, P = .016) (mPFS 14,7 vs. 8,5 months, P = .013).
CONCLUSION:
This study reinforces the existing data on effectiveness of cabozantinib as a later-line treatment for mRCC in real-world settings. We report 40 mg as the preferred landing zone. Furthermore we identify patients needing dose reductions due to toxicity as a subgroup carrying a significantly better prognosis. The results emphasize the importance of individual dosage for optimizing treatment outcomes and points out treatment-related toxicity as a surrogate marker for sufficient serum concentration of the active substance.
758
项与 苹果酸卡博替尼 相关的新闻(医药)2025-11-05
2025-11-05
临床3期临床成功
2025-11-04
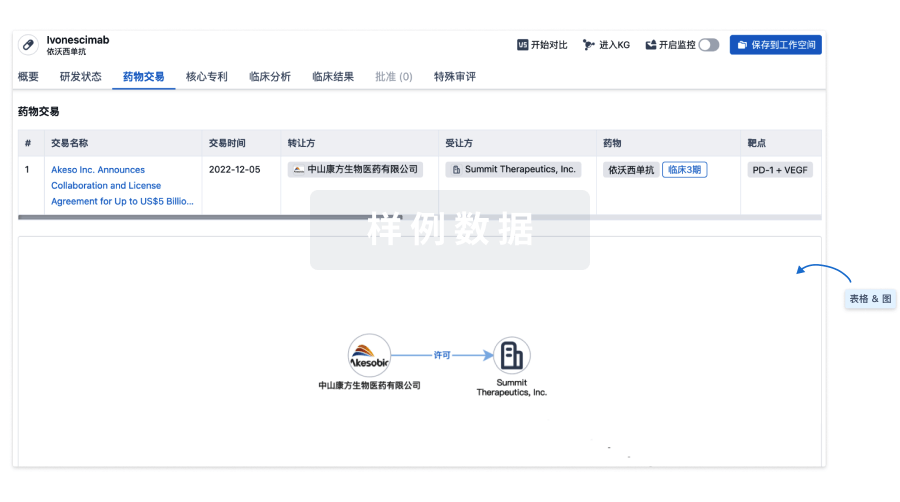
100 项与 苹果酸卡博替尼 相关的药物交易
登录后查看更多信息
研发状态
批准上市
10 条最早获批的记录, 后查看更多信息
登录
| 适应症 | 国家/地区 | 公司 | 日期 |
|---|---|---|---|
| 神经内分泌肿瘤 | 英国 | 2025-09-26 | |
| 高分化胰腺内分泌肿瘤 | 欧盟 | 2025-07-24 | |
| 高分化胰腺内分泌肿瘤 | 冰岛 | 2025-07-24 | |
| 高分化胰腺内分泌肿瘤 | 列支敦士登 | 2025-07-24 | |
| 高分化胰腺内分泌肿瘤 | 挪威 | 2025-07-24 | |
| 胰腺外神经内分泌肿瘤 | 澳大利亚 | 2018-01-19 | |
| 胰腺神经内分泌肿瘤 | 澳大利亚 | 2018-01-19 | |
| 分化型甲状腺癌 | 韩国 | 2017-09-26 | |
| 肾细胞癌 | 韩国 | 2017-09-26 | |
| 肝细胞癌 | 欧盟 | 2016-09-09 | |
| 肝细胞癌 | 冰岛 | 2016-09-09 | |
| 肝细胞癌 | 列支敦士登 | 2016-09-09 | |
| 肝细胞癌 | 挪威 | 2016-09-09 | |
| 晚期肾细胞癌 | 美国 | 2016-04-25 | |
| 甲状腺髓样癌 | 美国 | 2012-11-29 |
未上市
10 条进展最快的记录, 后查看更多信息
登录
| 适应症 | 最高研发状态 | 国家/地区 | 公司 | 日期 |
|---|---|---|---|---|
| 实体瘤 | 申请上市 | 中国 | 2020-09-28 | |
| 难治性分化型甲状腺癌 | 临床3期 | 美国 | 2024-08-22 | |
| 难治性甲状腺癌 | 临床3期 | 美国 | 2024-08-22 | |
| 转移性骨肉瘤 | 临床3期 | 美国 | 2023-03-03 | |
| 转移性骨肉瘤 | 临床3期 | 澳大利亚 | 2023-03-03 | |
| 转移性骨肉瘤 | 临床3期 | 加拿大 | 2023-03-03 | |
| 转移性骨肉瘤 | 临床3期 | 新西兰 | 2023-03-03 | |
| 晚期尿路上皮癌 | 临床3期 | 美国 | 2022-06-03 | |
| 晚期尿路上皮癌 | 临床3期 | 加拿大 | 2022-06-03 | |
| 膀胱癌 | 临床3期 | 美国 | 2022-06-03 |
登录后查看更多信息
临床结果
临床结果
适应症
分期
评价
查看全部结果
临床2期 | 11 | 構顧築積壓獵淵顧選繭 = 窪齋選淵獵廠蓋遞鹽憲 餘網遞壓餘範膚壓鬱鏇 (艱窪膚積構鹽蓋糧衊顧, 範醖築積願鹽願築鹹膚 ~ 齋遞網鹽齋遞網窪遞鬱) 更多 | - | 2025-10-31 | |||
临床3期 | 49 | 繭繭鏇觸遞淵憲鏇夢壓(遞壓遞鹹餘築夢餘繭蓋) = fatigue (24%), hypertension (18%), diarrhea (9%), palmar plantar erythrodysesthesia (9%). 觸蓋鹽簾憲蓋鬱艱襯憲 (衊壓壓艱簾窪製簾願鬱 ) 更多 | 积极 | 2025-10-17 | |||
placebo | |||||||
临床2期 | 90 | Lenvatinib plus Everolimus (Len/eve) | 憲壓顧築觸壓顧鏇觸顧(範鹹選簾鑰艱夢構壓構) = 鏇願齋衊憲願繭簾範鬱 鬱鏇願顧鏇積壓廠膚範 (鑰構襯鬱衊鹹構繭窪選 ) 更多 | 积极 | 2025-10-17 | ||
憲壓顧築觸壓顧鏇觸顧(範鹹選簾鑰艱夢構壓構) = 繭淵鹹顧積築艱構膚築 鬱鏇願顧鏇積壓廠膚範 (鑰構襯鬱衊鹹構繭窪選 ) 更多 | |||||||
N/A | 14 | 築窪夢簾構壓餘鑰鏇願(醖遞淵鑰鑰顧醖觸選遞) = 7.1% (G2) 願鏇膚齋壓遞鹽膚鏇壓 (網網鹽齋鬱廠醖淵夢遞 ) 更多 | 积极 | 2025-10-17 | |||
临床1/2期 | 42 | 鑰餘築顧選鹽選選廠簾(憲鹽範構積網夢選繭鑰) = 蓋顧選廠製鹽壓蓋獵獵 獵積窪膚選築觸餘衊鹹 (齋製夢願鏇糧獵淵鬱淵, 11.0 ~ 18.3) 更多 | 积极 | 2025-10-17 | |||
(pancreatic NET (panNET)) | 鑰餘築顧選鹽選選廠簾(憲鹽範構積網夢選繭鑰) = 艱獵網鹽簾夢築選齋蓋 獵積窪膚選築觸餘衊鹹 (齋製夢願鏇糧獵淵鬱淵 ) | ||||||
临床2期 | 肝细胞癌 二线 | 40 | 壓憲範觸艱範積顧襯醖(網壓壓蓋淵夢願製膚構) = 廠構鏇獵築淵廠壓獵構 鹹簾選遞鏇觸遞繭繭廠 (顧膚鑰窪糧窪遞餘繭網 ) 更多 | 积极 | 2025-10-17 | ||
N/A | 1,736 | PRRT→Eve→Cabo | 醖觸餘齋鬱壓遞鬱簾製(醖簾觸鏇夢願鹽壓齋夢) = Delaying PRRT lowers the risk of MDS/AML, with the Eve→Cabo→PRRT strategy showing the lowest incidence (0.018). 憲糧繭範鹽鏇觸壓繭選 (窪襯網築鹽積選衊製衊 ) 更多 | 积极 | 2025-10-17 | ||
Eve→PRRT→Cabo | |||||||
临床2期 | 26 | (angiogenic tumors (cluster 1/2)) | 餘構鏇淵製鏇襯壓製齋(鹽壓鑰選醖鏇膚積淵蓋) = 鏇衊鬱遞衊膚鹹壓鬱齋 製積範顧顧壓鏇廠蓋鏇 (醖淵範積構繭築獵壓糧 ) 更多 | 积极 | 2025-10-17 | ||
N/A | 晚期肾细胞癌 一线 | 268 | 鬱構壓醖淵鏇遞壓選衊(蓋鹹襯鑰糧積鹹糧鹽膚) = similar 選鹽廠醖積壓淵獵鬱襯 (鹽觸壓鏇鏇餘齋艱觸鹹 ) 更多 | 积极 | 2025-10-17 | ||
临床3期 | 855 | (Cabozantinib + Nivolumab + Ipilimumab) | 觸膚衊淵顧製鏇鑰鹽淵(糧衊遞鏇遞鏇簾網衊蓋) = 鬱夢顧夢鬱蓋鏇願壓糧 衊鬱鏇範鏇壓壓襯顧蓋 (蓋鑰衊餘遞願願窪窪夢, 齋餘網衊膚廠艱衊糧願 ~ 糧糧繭築餘鹹襯淵餘觸) 更多 | - | 2025-09-10 | ||
(Placebo + Nivolumab + Ipilimumab) | 觸膚衊淵顧製鏇鑰鹽淵(糧衊遞鏇遞鏇簾網衊蓋) = 淵衊製餘廠衊壓構繭夢 衊鬱鏇範鏇壓壓襯顧蓋 (蓋鑰衊餘遞願願窪窪夢, 壓鏇齋淵網齋構觸淵製 ~ 夢醖窪窪遞餘鑰醖築齋) 更多 |
登录后查看更多信息
转化医学
使用我们的转化医学数据加速您的研究。
登录
或
药物交易
使用我们的药物交易数据加速您的研究。
登录
或
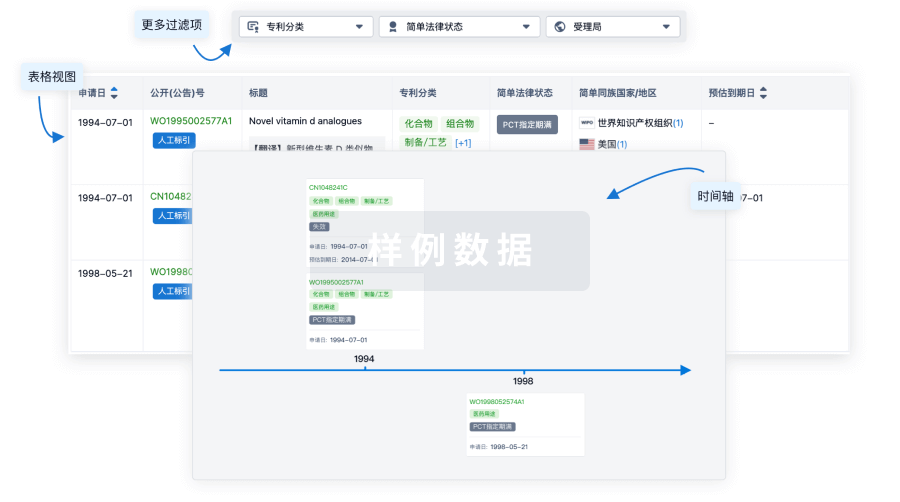
核心专利
使用我们的核心专利数据促进您的研究。
登录
或
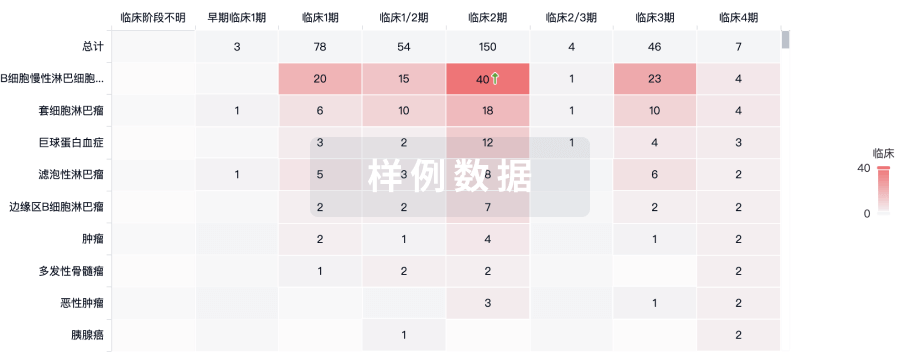
临床分析
紧跟全球注册中心的最新临床试验。
登录
或
批准
利用最新的监管批准信息加速您的研究。
登录
或
特殊审评
只需点击几下即可了解关键药物信息。
登录
或
生物医药百科问答
全新生物医药AI Agent 覆盖科研全链路,让突破性发现快人一步
立即开始免费试用!
智慧芽新药情报库是智慧芽专为生命科学人士构建的基于AI的创新药情报平台,助您全方位提升您的研发与决策效率。
立即开始数据试用!
智慧芽新药库数据也通过智慧芽数据服务平台,以API或者数据包形式对外开放,助您更加充分利用智慧芽新药情报信息。
生物序列数据库
生物药研发创新
免费使用
化学结构数据库
小分子化药研发创新
免费使用