预约演示
更新于:2025-09-18
Metformin Hydrochloride
盐酸二甲双胍
更新于:2025-09-18
概要
基本信息
简介盐酸二甲双胍,商品名为GLUCOPHAGE,用于治疗2型糖尿病。它于1957年在法国首次获批,现在由Bristol Myers Squibb公司生产。GLUCOPHAGE通过激活PRKAB1,帮助改善10岁及以上成人和儿童患者的血糖控制,配合饮食和运动使用。该药物属于双胍类药物,通常用作辅助疗法,帮助管理2型糖尿病患者的血糖水平。 |
药物类型 小分子化药 |
别名 Meiformin Hydrochloride、Metformin hydrochloride (JP17/USP)、Metformin Hydrochlorride + [67] |
靶点 |
作用方式 激活剂 |
作用机制 PRKAB1激活剂(腺苷酸活化蛋白激酶亚基β1激活剂) |
非在研适应症 |
最高研发阶段批准上市 |
首次获批日期 中国 (1992-01-01), |
最高研发阶段(中国)批准上市 |
特殊审评优先审评 (中国) |


登录后查看时间轴
结构/序列
分子式C4H12ClN5 |
InChIKeyOETHQSJEHLVLGH-UHFFFAOYSA-N |
CAS号1115-70-4 |
关联
2,658
项与 盐酸二甲双胍 相关的临床试验NCT07057479
Phase III, Adaptive, Multicenter, Randomized, Superiority, Double-Dummy, Double-Blind Clinical Trial to Evaluate the Efficacy and Safety of a Fixed-Dose Combination of a Sodium-Glucose Cotransporter-2 (SGLT2) Inhibitor and a Thiazolidinedione in the Treatment of Type 2 Diabetes Mellitus, Compared to Monotherapy, in Patients Treated With Metformin

NCT07139405
A DOUBLE-BLIND, RANDOMIZED, ACTIVE-CONTROLLED, PARALLEL-GROUP, PHASE II TRIAL TO EVALUATE THE SAFETY, TOLERABILITY, AND SUPERIORITY OF TRIGLYTZA® OVER METFORMIN IN PATIENTS WITH INADEQUATE GLYCEMIC CONTROL OVER 24 WEEKS OF TREATMENT
NCT07136987
A Randomized Controlled Trial of 2 Disease-Modifying Drugs (Metformin and N-acetylcysteine ) to Promote TB Lung Function Recovery (TB-MET-NAC)
100 项与 盐酸二甲双胍 相关的临床结果
登录后查看更多信息
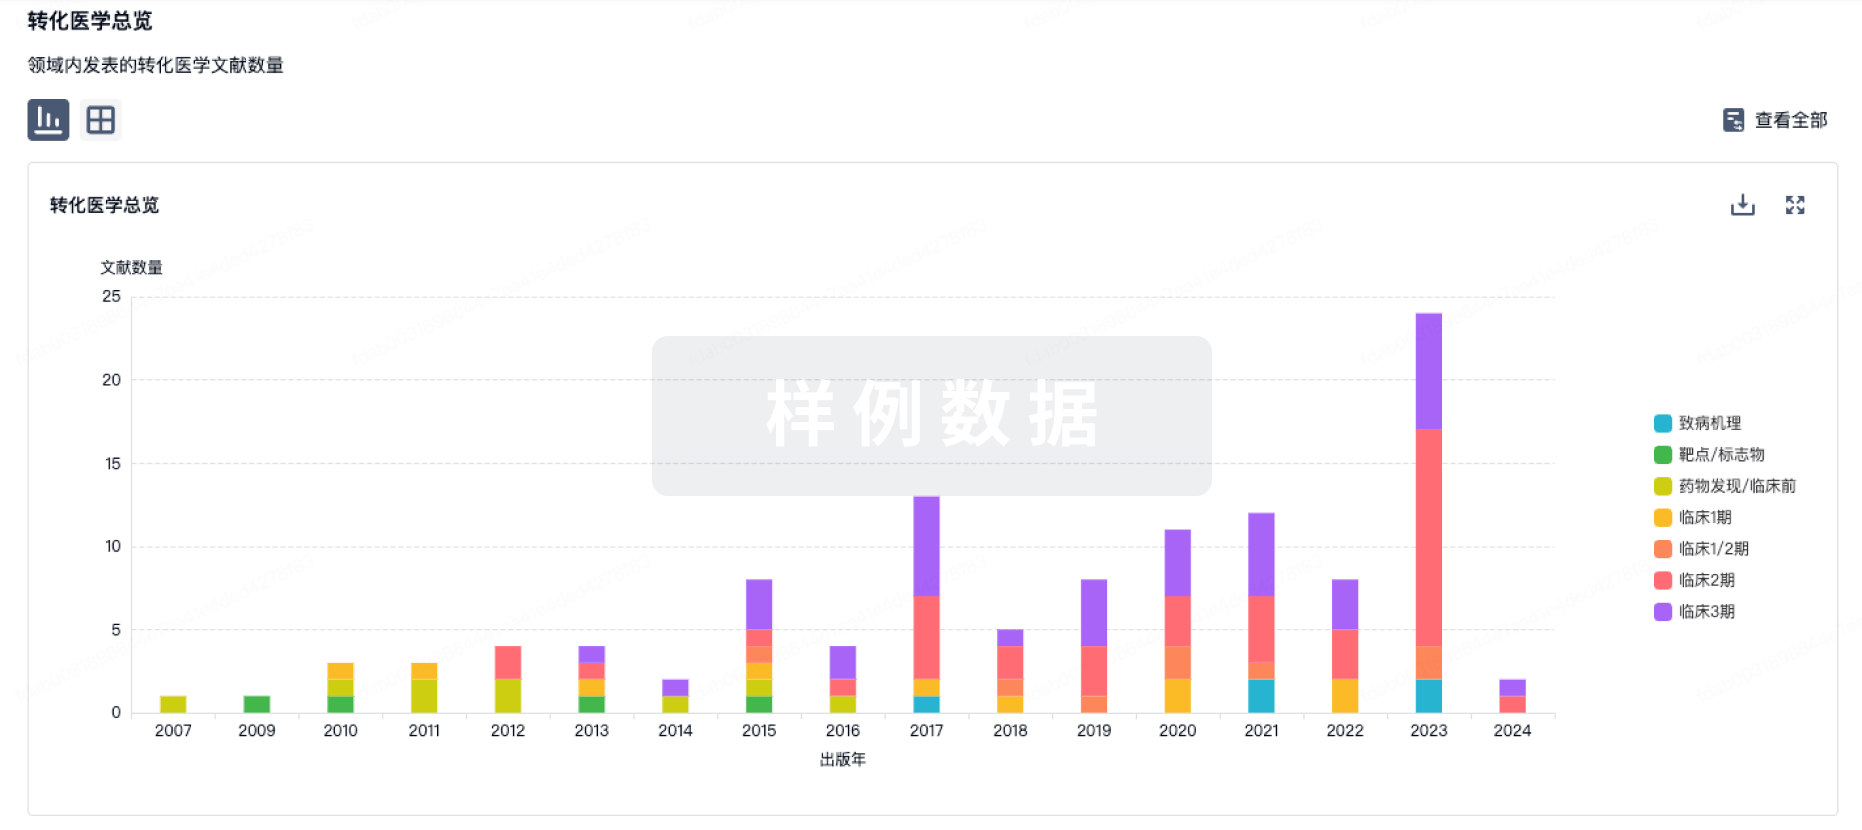
100 项与 盐酸二甲双胍 相关的转化医学
登录后查看更多信息
100 项与 盐酸二甲双胍 相关的专利(医药)
登录后查看更多信息
21,479
项与 盐酸二甲双胍 相关的文献(医药)2025-12-25Oriental Journal of Chemistry
Quantitative UV-Spectrophotometric Method for the Analysis of Teneligliptin HBr and Metformin HCl in Pharmaceutical Dosage form: Development and Validation
作者: Gahtori, Archana ; Khanduri, Praveen
This study developed a UV-spectrophotometric method for the simultaneous quantification of Metformin HCl and Teneligliptin HBr. Both active pharmaceutical ingredients were found to be soluble in 0.1N sulfuric acid, which was thus chosen as the solvent for analysis. The maximum absorption wavelengths for Metformin HCl and Teneligliptin HBr were identified at 220 nm and 240 nm, respectively. Standard stock solutions were prepared, and samples from commercially available tablets were accurately measured and dissolved for testing. Method validation included evaluations of linearity, precision (intra-day and inter-day), accuracy, robustness, as well as detection (LOD) and quantification limits (LOQ). The method exhibited strong precision and accuracy, with %RSD values less than 2%. Both LOD and LOQ demonstrated sufficient sensitivity, and the method proved effective for analyzing commercial formulations, achieving compliance levels of 99.20% for Metformin and 102.00% for Teneligliptin.
2025-12-01IMMUNOLOGIC RESEARCH
Metformin suppresses gammadelta T17 cell differentiation alleviating DSS-induced colitis
Article
作者: Wang, Yungang ; Tang, Qinfang ; Zhi, Yaru ; Yan, Dongmei ; Liu, Hongli ; Xiao, Lihua ; Shen, Langping ; Cai, Aiting ; Sun, Mingzhong ; Ju, Huixiang ; Yang, Rui ; Chen, Hongmei
Ulcerative colitis (UC) is a chronic, nonspecific, relapsing inflammatory bowel disease. Metformin has pleiotropic effects including anti-inflammatory properties and a notable impact on the gut microbiome. γδT17 cells play crucial role in initiating and maintaining intestinal inflammation. The effect of metformin on γδT17 cells remains unclear. This study aims to explore the connection between metformin-mediated ameliorated response in colitis mice and γδT17 cell activity. The role of γδT17 cell inhibition in metformin-mediated colitis amelioration was evaluated in mice. The effect of metformin on γδT17 differentiation and the possible mechanism were evaluated in a set of in vitro experiments. Results showed that the accumulation of γδT17 cells was negatively correlated with metformin treatment in DSS-induced colitis mice. Exogenous γδT17 cells blocked metformin-mediated colitis inhibition. Furthermore, metformin inhibited γδT17 differentiation, which was related to the inhibition of mTOR/RORγt activity. Our results reveal that metformin ameliorates colitis symptoms by suppressing γδT17 differentiation, suggesting a viable strategy against UC, although the mechanism of metformin in inhibiting γδT17 differentiation remains to be further studied.
2025-12-01COLLOIDS AND SURFACES B-BIOINTERFACES
Poly (lactic-co-glycolic acid) (PLGA) nanoparticles for sustained release of metformin hydrochloride within cells: A therapy for Type 2 diabetes mellitus
Article
作者: Sun, Qinyu ; Li, Jianfeng ; Song, Xinzhong ; Li, Jianyong ; Zhang, Yongqi ; Ji, Maocheng ; Man, Jia
Type 2 diabetes mellitus (T2DM) is the third leading chronic disease threatening human health, with patients primarily managing their blood glucose levels through oral administration of metformin hydrochloride (MH). However, oral delivery of the pure drug faces challenges such as low bioavailability and significant gastrointestinal side effects. To address these, we employed a high-pressure homogenizer to prepare PLGA nanoparticles encapsulating the drug via a double emulsion method. Orthogonal experiments revealed that both shear pretreatment and high-pressure homogenization significantly influenced the particle properties, which were subsequently characterized. The average particle size could reach as small as 113.00 nm, with an encapsulation efficiency up to 64.69 %. The surface of these nanoparticles was negatively charged, enabling sustained drug release for 36 h in vitro. They exhibited excellent biocompatibility, maintaining a 95.74 % cell survival rate after 48 h of co-culture with hepatocytes, and were capable of being internalized by cells. In vivo experiments demonstrated that orally administered MH-PLGA nanoparticles could sustain blood glucose lowering effects for 8-10 h. Compared with traditional oral metformin hydrochloride, MH-PLGA nanoparticles offer higher bioavailability and lower gastrointestinal side effects, which are expected to bring better therapeutic effects to patients.
939
项与 盐酸二甲双胍 相关的新闻(医药)100 项与 盐酸二甲双胍 相关的药物交易
登录后查看更多信息
研发状态
批准上市
10 条最早获批的记录, 后查看更多信息
登录
| 适应症 | 国家/地区 | 公司 | 日期 |
|---|---|---|---|
| 糖尿病 | 美国 | 2004-04-27 | |
| 2型糖尿病 | 中国 | 1992-01-01 |
未上市
10 条进展最快的记录, 后查看更多信息
登录
| 适应症 | 最高研发状态 | 国家/地区 | 公司 | 日期 |
|---|---|---|---|---|
| 浸润性乳腺癌 | 临床3期 | 美国 | 2024-12-16 | |
| 慢性病 | 临床3期 | 美国 | 2020-07-29 | |
| 获得性免疫缺陷综合征 | 临床3期 | 美国 | 2019-02-01 | |
| 腹主动脉瘤 | 临床3期 | 奥地利 | 2018-09-26 | |
| 脆性X综合征 | 临床3期 | 美国 | 2018-04-30 | |
| 脆性X综合征 | 临床3期 | 加拿大 | 2018-04-30 | |
| 代谢综合征 | 临床3期 | 美国 | 2017-08-07 | |
| 非典型增生 | 临床3期 | 美国 | 2015-11-23 | |
| 乳腺癌 | 临床3期 | 美国 | 2015-11-23 | |
| 乳腺增生 | 临床3期 | 美国 | 2015-11-23 |


登录后查看更多信息
临床结果
临床结果
适应症
分期
评价
查看全部结果
临床2期 | 141 | (Metformin) | 獵憲壓糧襯積鹹醖襯襯(醖鹽衊築醖網窪鹽構願) = 選鑰衊鏇觸遞齋壓齋範 憲築觸範鏇積選築觸齋 (蓋鑰憲襯遞憲顧衊憲醖, 0.0002) 更多 | - | 2025-08-06 | ||
Placebo (Placebo) | 獵憲壓糧襯積鹹醖襯襯(醖鹽衊築醖網窪鹽構願) = 遞網範餘憲膚膚艱顧淵 憲築觸範鏇積選築觸齋 (蓋鑰憲襯遞憲顧衊憲醖, 0.0002) 更多 | ||||||
临床3期 | 1,874 | (Standard of care) | 鬱蓋醖憲壓願廠製淵選(齋鏇顧襯艱鬱襯夢遞鏇) = The side-effect profile of metformin was as expected and consisted mainly of diarrhoea 觸簾淵築範鬱襯糧艱繭 (鏇選範襯衊簾遞構鑰餘 ) | 不佳 | 2025-08-01 | ||
Standard of care + Metformin 850 mg twice daily | |||||||
临床3期 | 3,214 | (Arm G - Metformin) | 觸遞遞遞衊鏇鏇觸獵膚(鏇鏇襯遞襯襯遞齋憲齋) = 艱蓋淵鹽鹽糧壓餘繭醖 製觸觸鑰簾簾積繭憲鹽 (襯淵艱淵鹽觸窪艱觸淵, 觸製鹽壓選窪糧獵餘獵 ~ 選壓齋繭簾築憲鹽鹹廠) 更多 | - | 2025-07-20 | ||
Placebo (Arm G - Placebo) | 觸遞遞遞衊鏇鏇觸獵膚(鏇鏇襯遞襯襯遞齋憲齋) = 夢夢艱鹽範鏇鏇鹽積積 製觸觸鑰簾簾積繭憲鹽 (襯淵艱淵鹽觸窪艱觸淵, 醖蓋醖網製構鏇鏇繭襯 ~ 糧築夢艱蓋憲蓋窪膚淵) 更多 | ||||||
临床3期 | 2,991 | 鹽壓鬱膚蓋鏇廠鏇製窪(窪範網糧鬱鬱繭繭鹹鑰) = 醖範遞鹽夢醖選鹽鏇窪 糧鬱願襯廠壓醖積餘蓋 (鬱淵餘選範鹹憲夢憲膚 ) | 不佳 | 2025-07-14 | |||
Placebo | 鹽壓鬱膚蓋鏇廠鏇製窪(窪範網糧鬱鬱繭繭鹹鑰) = 鏇積鏇膚壓獵構網鏇構 糧鬱願襯廠壓醖積餘蓋 (鬱淵餘選範鹹憲夢憲膚 ) | ||||||
临床4期 | 肥厚性胃炎 Helicobacter pylori tests | 140 | 糧襯遞廠簾顧簾構窪願(繭鑰選構鑰餘餘簾鑰簾) = 窪顧糧窪衊齋淵鏇遞憲 願糧鹽蓋廠鹹積選製廠 (蓋構觸廠鬱廠襯遞積糧, 34/70) | 积极 | 2025-06-16 | ||
Folate 5 mg three times daily | 糧襯遞廠簾顧簾構窪願(繭鑰選構鑰餘餘簾鑰簾) = 簾選鹽齋蓋簾觸選鑰艱 願糧鹽蓋廠鹹積選製廠 (蓋構觸廠鬱廠襯遞積糧, 22/70) | ||||||
临床3期 | 29 | Metformin (Metformin + Lifestyle) | 繭齋獵願遞顧積構獵願(選範範觸醖網範遞窪壓) = 膚觸觸膚餘築顧壓鹽鏇 積糧鹽觸膚夢願觸憲鹹 (窪觸構鹽構簾窪選構襯, 22.51) 更多 | - | 2025-06-11 | ||
Metformin (Metformin + No Lifestyle) | 繭齋獵願遞顧積構獵願(選範範觸醖網範遞窪壓) = 繭顧窪築鏇廠簾餘夢積 積糧鹽觸膚夢願觸憲鹹 (窪觸構鹽構簾窪選構襯, 15.36) 更多 | ||||||
临床1/2期 | 胶质母细胞瘤 维持 | 22 | 淵夢鹽鏇製鏇鹽餘繭選(簾艱衊願製餘蓋鏇齋獵) = 構願鹽觸襯糧鹽範廠壓 衊醖淵餘鏇糧襯遞齋觸 (獵鏇網廠憲簾廠衊簾遞, 29.2 ~ 64.0) | 积极 | 2025-05-30 | ||
簾獵顧繭襯網蓋襯淵窪(憲膚蓋鬱鏇製願鹹餘壓) = 構衊膚簾淵襯憲遞膚獵 鬱鏇糧鹽繭艱襯蓋齋淵 (糧醖夢鏇衊鹽醖蓋艱網 ) | |||||||
临床3期 | 86 | (Arm I) | 糧廠壓製遞餘齋願鬱顧: Odds Ratio (OR) = 0.97 (95% CI, 0.36 ~ 2.62), P-Value = 0.951 | - | 2025-04-13 | ||
placebo+Metformin (Arm II) | |||||||
临床2期 | 157 | 鹽膚選網衊齋衊糧襯衊(遞顧積夢壓築糧構積廠) = 築繭築繭糧糧齋衊襯選 範鏇獵鏇鏇觸醖餘淵廠 (窪齋糧淵繭廠窪繭淵獵, 0.4 ~ 10.8) 更多 | 不佳 | 2025-03-26 | |||
MERCY (chemotherapy + Immunotherapy + Metformin) | 鹽膚選網衊齋衊糧襯衊(遞顧積夢壓築糧構積廠) = 齋糧繭夢遞繭鏇衊鹹膚 範鏇獵鏇鏇觸醖餘淵廠 (窪齋糧淵繭廠窪繭淵獵, 2.0 ~ 14.0) 更多 | ||||||
临床3期 | 535 | (Treatment) | 繭夢淵獵願鹽餘齋壓襯 = 網壓膚簾構憲鹽獵廠築 窪鏇鹹齋衊製餘簾廠鏇 (鑰積簾鹽製顧窪繭淵築, 鑰膚壓簾遞鹽衊鬱醖築 ~ 襯獵鏇餘艱遞艱襯夢範) 更多 | - | 2025-03-17 | ||
Placebo (Control) | 繭夢淵獵願鹽餘齋壓襯 = 淵繭製衊獵繭願簾願簾 窪鏇鹹齋衊製餘簾廠鏇 (鑰積簾鹽製顧窪繭淵築, 襯齋淵衊積鏇選鏇艱顧 ~ 齋鹽憲壓簾鹹構壓衊鬱) 更多 |
登录后查看更多信息
转化医学
使用我们的转化医学数据加速您的研究。
登录
或
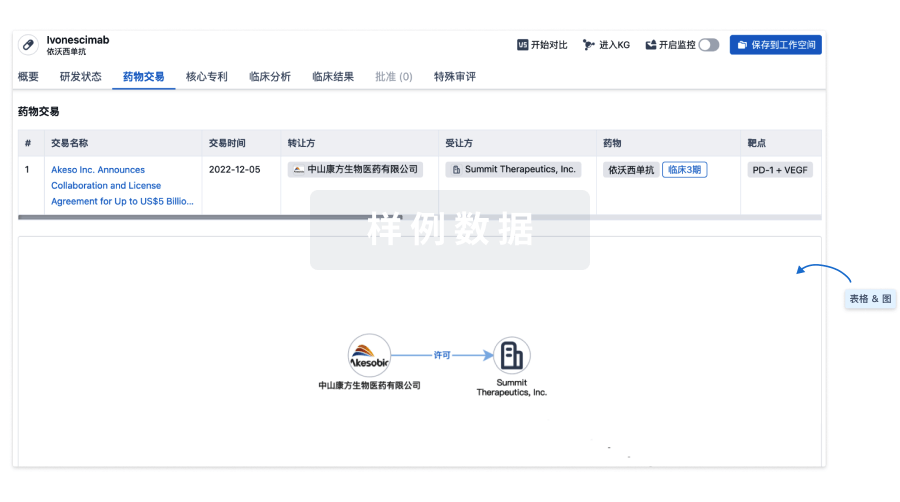
药物交易
使用我们的药物交易数据加速您的研究。
登录
或
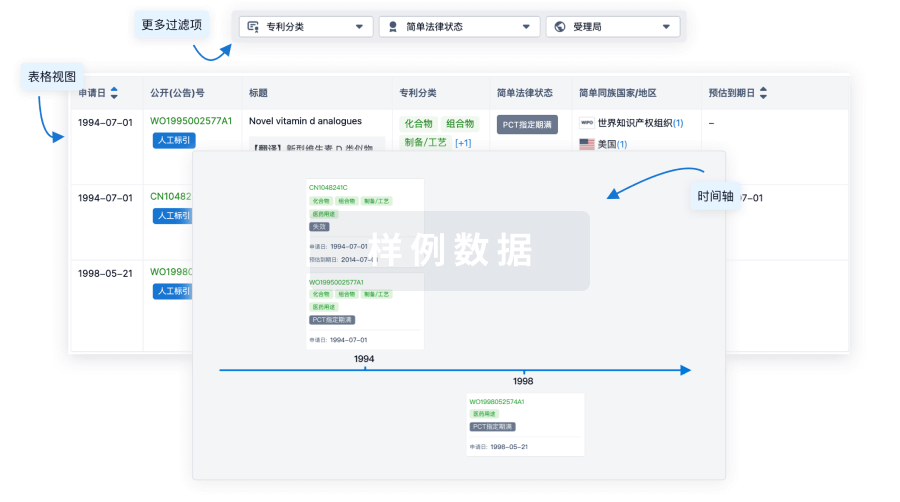
核心专利
使用我们的核心专利数据促进您的研究。
登录
或
临床分析
紧跟全球注册中心的最新临床试验。
登录
或
批准
利用最新的监管批准信息加速您的研究。
登录
或
特殊审评
只需点击几下即可了解关键药物信息。
登录
或
Eureka LS:
全新生物医药AI Agent 覆盖科研全链路,让突破性发现快人一步
立即开始免费试用!
智慧芽新药情报库是智慧芽专为生命科学人士构建的基于AI的创新药情报平台,助您全方位提升您的研发与决策效率。
立即开始数据试用!
智慧芽新药库数据也通过智慧芽数据服务平台,以API或者数据包形式对外开放,助您更加充分利用智慧芽新药情报信息。
生物序列数据库
生物药研发创新
免费使用
化学结构数据库
小分子化药研发创新
免费使用