Global Drug Discovery Services Market to Reach $61.1 Billion by 2030
2023-02-08
NEW YORK, Feb. 8, 2023 /PRNewswire/ -- The global economy is at a critical crossroads with a number of interlocking challenges and crises running in parallel. The uncertainty around how Russia's war on Ukraine will play out this year and the war's role in creating global instability means that the trouble on the inflation front is not over yet. Food and fuel inflation will remain a persistent economic problem. Higher retail inflation will impact consumer confidence and spending. As governments combat inflation by raising interest rates, new job creation will slowdown and impact economic activity and growth. Lower capital expenditure is in the offing as companies go slow on investments, held back by inflation worries and weaker demand. With slower growth and high inflation, developed markets seem primed to enter into a recession. Fears of new COVID outbreaks and China's already uncertain post-pandemic path poses a real risk of the world experiencing more acute supply chain pain and manufacturing disruptions this year. Volatile financial markets, growing trade tensions, stricter regulatory environment and pressure to mainstream climate change into economic decisions will compound the complexity of challenges faced. Year 2023 is expected to be tough year for most markets, investors and consumers. Nevertheless, there is always opportunity for businesses and their leaders who can chart a path forward with resilience and adaptability.
Continue Reading
Preview
来源: PRNewswire
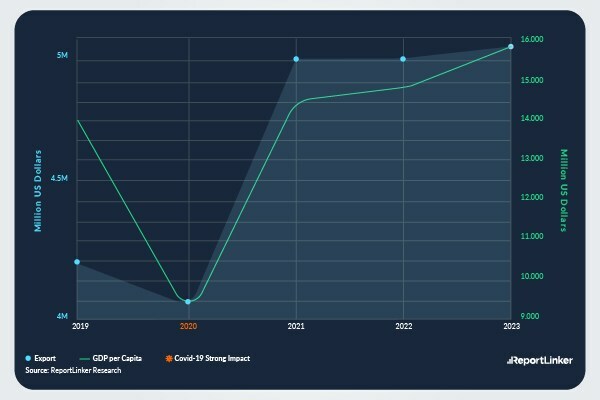
Source: ReportLinker Research
Read the full report: https://www.reportlinker.com/p06031398/?utm_source=PRN
Global Drug Discovery Services Market to Reach $61.1 Billion by 2030
In the changed post COVID-19 business landscape, the global market for Drug Discovery Services estimated at US$42.9 Billion in the year 2022, is projected to reach a revised size of US$61.1 Billion by 2030, growing at a CAGR of 4.5% over the analysis period 2022-2030. Medicinal Chemistry Services, one of the segments analyzed in the report, is projected to record a 5.3% CAGR and reach US$31.6 Billion by the end of the analysis period. Taking into account the ongoing post pandemic recovery, growth in the Biology Services segment is readjusted to a revised 4% CAGR for the next 8-year period.
The U.S. Market is Estimated at $11.5 Billion, While China is Forecast to Grow at 8.2% CAGR
The Drug Discovery Services market in the U.S. is estimated at US$11.5 Billion in the year 2022. China, the world`s second largest economy, is forecast to reach a projected market size of US$14.1 Billion by the year 2030 trailing a CAGR of 8.2% over the analysis period 2022 to 2030. Among the other noteworthy geographic markets are Japan and Canada, each forecast to grow at 1.9% and 2.7% respectively over the 2022-2030 period. Within Europe, Germany is forecast to grow at approximately 2.5% CAGR. Led by countries such as Australia, India, and South Korea, the market in Asia-Pacific is forecast to reach US$9.1 Billion by the year 2030.
Select Competitors (Total 33 Featured)
- Domainex
- Selvita S.A.
Read the full report: https://www.reportlinker.com/p06031398/?utm_source=PRN
I. METHODOLOGY
II. EXECUTIVE SUMMARY
1. MARKET OVERVIEW
Influencer Market Insights
World Market Trajectories
Impact of Covid-19 and a Looming Global Recession
Drug Discovery Services - Global Key Competitors Percentage
Market Share in 2022 (E)
Competitive Market Presence - Strong/Active/Niche/Trivial for
Players Worldwide in 2022 (E)
2. FOCUS ON SELECT PLAYERS
3. MARKET TRENDS & DRIVERS
4. GLOBAL MARKET PERSPECTIVE
Table 1: World Recent Past, Current & Future Analysis for Drug
Discovery Services by Geographic Region - USA, Canada, Japan,
China, Europe, Asia-Pacific, Latin America, Middle East and
Africa Markets - Independent Analysis of Annual Sales in US$
Million for Years 2022 through 2030 and % CAGR
Table 2: World Historic Review for Drug Discovery Services by
Geographic Region - USA, Canada, Japan, China, Europe,
Asia-Pacific, Latin America, Middle East and Africa Markets -
Independent Analysis of Annual Sales in US$ Million for Years
2012 through 2021 and % CAGR
Table 3: World 18-Year Perspective for Drug Discovery Services
by Geographic Region - Percentage Breakdown of Value Sales for
USA, Canada, Japan, China, Europe, Asia-Pacific, Latin America,
Middle East and Africa Markets for Years 2012, 2023 & 2030
Table 4: World Recent Past, Current & Future Analysis for
Medicinal Chemistry Services by Geographic Region - USA,
Canada, Japan, China, Europe, Asia-Pacific, Latin America,
Middle East and Africa Markets - Independent Analysis of Annual
Sales in US$ Million for Years 2022 through 2030 and % CAGR
Table 5: World Historic Review for Medicinal Chemistry Services
by Geographic Region - USA, Canada, Japan, China, Europe,
Asia-Pacific, Latin America, Middle East and Africa Markets -
Independent Analysis of Annual Sales in US$ Million for Years
2012 through 2021 and % CAGR
Table 6: World 18-Year Perspective for Medicinal Chemistry
Services by Geographic Region - Percentage Breakdown of Value
Sales for USA, Canada, Japan, China, Europe, Asia-Pacific,
Latin America, Middle East and Africa for Years 2012, 2023 &
2030
Table 7: World Recent Past, Current & Future Analysis for
Biology Services by Geographic Region - USA, Canada, Japan,
China, Europe, Asia-Pacific, Latin America, Middle East and
Africa Markets - Independent Analysis of Annual Sales in US$
Million for Years 2022 through 2030 and % CAGR
Table 8: World Historic Review for Biology Services by
Geographic Region - USA, Canada, Japan, China, Europe,
Asia-Pacific, Latin America, Middle East and Africa Markets -
Independent Analysis of Annual Sales in US$ Million for Years
2012 through 2021 and % CAGR
Table 9: World 18-Year Perspective for Biology Services by
Geographic Region - Percentage Breakdown of Value Sales for
USA, Canada, Japan, China, Europe, Asia-Pacific, Latin America,
Middle East and Africa for Years 2012, 2023 & 2030
Table 10: World Recent Past, Current & Future Analysis for Drug
Metabolism & Pharmacokinetics by Geographic Region - USA,
Canada, Japan, China, Europe, Asia-Pacific, Latin America,
Middle East and Africa Markets - Independent Analysis of Annual
Sales in US$ Million for Years 2022 through 2030 and % CAGR
Table 11: World Historic Review for Drug Metabolism &
Pharmacokinetics by Geographic Region - USA, Canada, Japan,
China, Europe, Asia-Pacific, Latin America, Middle East and
Africa Markets - Independent Analysis of Annual Sales in US$
Million for Years 2012 through 2021 and % CAGR
Table 12: World 18-Year Perspective for Drug Metabolism &
Pharmacokinetics by Geographic Region - Percentage Breakdown of
Value Sales for USA, Canada, Japan, China, Europe,
Asia-Pacific, Latin America, Middle East and Africa for Years
2012, 2023 & 2030
Table 13: World Recent Past, Current & Future Analysis for
Cardiovascular Diseases by Geographic Region - USA, Canada,
Japan, China, Europe, Asia-Pacific, Latin America, Middle East
and Africa Markets - Independent Analysis of Annual Sales in
US$ Million for Years 2022 through 2030 and % CAGR
Table 14: World Historic Review for Cardiovascular Diseases by
Geographic Region - USA, Canada, Japan, China, Europe,
Asia-Pacific, Latin America, Middle East and Africa Markets -
Independent Analysis of Annual Sales in US$ Million for Years
2012 through 2021 and % CAGR
Table 15: World 18-Year Perspective for Cardiovascular Diseases
by Geographic Region - Percentage Breakdown of Value Sales for
USA, Canada, Japan, China, Europe, Asia-Pacific, Latin America,
Middle East and Africa for Years 2012, 2023 & 2030
Table 16: World Recent Past, Current & Future Analysis for
Other Therapeutic Areas by Geographic Region - USA, Canada,
Japan, China, Europe, Asia-Pacific, Latin America, Middle East
and Africa Markets - Independent Analysis of Annual Sales in
US$ Million for Years 2022 through 2030 and % CAGR
Table 17: World Historic Review for Other Therapeutic Areas by
Geographic Region - USA, Canada, Japan, China, Europe,
Asia-Pacific, Latin America, Middle East and Africa Markets -
Independent Analysis of Annual Sales in US$ Million for Years
2012 through 2021 and % CAGR
Table 18: World 18-Year Perspective for Other Therapeutic Areas
by Geographic Region - Percentage Breakdown of Value Sales for
USA, Canada, Japan, China, Europe, Asia-Pacific, Latin America,
Middle East and Africa for Years 2012, 2023 & 2030
Table 19: World Recent Past, Current & Future Analysis for
Oncology by Geographic Region - USA, Canada, Japan, China,
Europe, Asia-Pacific, Latin America, Middle East and Africa
Markets - Independent Analysis of Annual Sales in US$ Million
for Years 2022 through 2030 and % CAGR
Table 20: World Historic Review for Oncology by Geographic
Region - USA, Canada, Japan, China, Europe, Asia-Pacific, Latin
America, Middle East and Africa Markets - Independent Analysis
of Annual Sales in US$ Million for Years 2012 through 2021 and
% CAGR
Table 21: World 18-Year Perspective for Oncology by Geographic
Region - Percentage Breakdown of Value Sales for USA, Canada,
Japan, China, Europe, Asia-Pacific, Latin America, Middle East
and Africa for Years 2012, 2023 & 2030
Table 22: World Recent Past, Current & Future Analysis for
Neurology by Geographic Region - USA, Canada, Japan, China,
Europe, Asia-Pacific, Latin America, Middle East and Africa
Markets - Independent Analysis of Annual Sales in US$ Million
for Years 2022 through 2030 and % CAGR
Table 23: World Historic Review for Neurology by Geographic
Region - USA, Canada, Japan, China, Europe, Asia-Pacific, Latin
America, Middle East and Africa Markets - Independent Analysis
of Annual Sales in US$ Million for Years 2012 through 2021 and
% CAGR
Table 24: World 18-Year Perspective for Neurology by Geographic
Region - Percentage Breakdown of Value Sales for USA, Canada,
Japan, China, Europe, Asia-Pacific, Latin America, Middle East
and Africa for Years 2012, 2023 & 2030
Table 25: World Recent Past, Current & Future Analysis for
Infectious & Immune System Diseases by Geographic Region - USA,
Canada, Japan, China, Europe, Asia-Pacific, Latin America,
Middle East and Africa Markets - Independent Analysis of Annual
Sales in US$ Million for Years 2022 through 2030 and % CAGR
Table 26: World Historic Review for Infectious & Immune System
Diseases by Geographic Region - USA, Canada, Japan, China,
Europe, Asia-Pacific, Latin America, Middle East and Africa
Markets - Independent Analysis of Annual Sales in US$ Million
for Years 2012 through 2021 and % CAGR
Table 27: World 18-Year Perspective for Infectious & Immune
System Diseases by Geographic Region - Percentage Breakdown of
Value Sales for USA, Canada, Japan, China, Europe,
Asia-Pacific, Latin America, Middle East and Africa for Years
2012, 2023 & 2030
Table 28: World Recent Past, Current & Future Analysis for
Digestive System Diseases by Geographic Region - USA, Canada,
Japan, China, Europe, Asia-Pacific, Latin America, Middle East
and Africa Markets - Independent Analysis of Annual Sales in
US$ Million for Years 2022 through 2030 and % CAGR
Table 29: World Historic Review for Digestive System Diseases
by Geographic Region - USA, Canada, Japan, China, Europe,
Asia-Pacific, Latin America, Middle East and Africa Markets -
Independent Analysis of Annual Sales in US$ Million for Years
2012 through 2021 and % CAGR
Table 30: World 18-Year Perspective for Digestive System
Diseases by Geographic Region - Percentage Breakdown of Value
Sales for USA, Canada, Japan, China, Europe, Asia-Pacific,
Latin America, Middle East and Africa for Years 2012, 2023 &
2030
Table 31: World Recent Past, Current & Future Analysis for
Small Molecules by Geographic Region - USA, Canada, Japan,
China, Europe, Asia-Pacific, Latin America, Middle East and
Africa Markets - Independent Analysis of Annual Sales in US$
Million for Years 2022 through 2030 and % CAGR
Table 32: World Historic Review for Small Molecules by
Geographic Region - USA, Canada, Japan, China, Europe,
Asia-Pacific, Latin America, Middle East and Africa Markets -
Independent Analysis of Annual Sales in US$ Million for Years
2012 through 2021 and % CAGR
Table 33: World 18-Year Perspective for Small Molecules by
Geographic Region - Percentage Breakdown of Value Sales for
USA, Canada, Japan, China, Europe, Asia-Pacific, Latin America,
Middle East and Africa for Years 2012, 2023 & 2030
Table 34: World Recent Past, Current & Future Analysis for
Biologics by Geographic Region - USA, Canada, Japan, China,
Europe, Asia-Pacific, Latin America, Middle East and Africa
Markets - Independent Analysis of Annual Sales in US$ Million
for Years 2022 through 2030 and % CAGR
Table 35: World Historic Review for Biologics by Geographic
Region - USA, Canada, Japan, China, Europe, Asia-Pacific, Latin
America, Middle East and Africa Markets - Independent Analysis
of Annual Sales in US$ Million for Years 2012 through 2021 and
% CAGR
Table 36: World 18-Year Perspective for Biologics by Geographic
Region - Percentage Breakdown of Value Sales for USA, Canada,
Japan, China, Europe, Asia-Pacific, Latin America, Middle East
and Africa for Years 2012, 2023 & 2030
Table 37: World Drug Discovery Services Market Analysis of
Annual Sales in US$ Million for Years 2012 through 2030
III. MARKET ANALYSIS
UNITED STATES
Drug Discovery Services Market Presence - Strong/Active/Niche/
Trivial - Key Competitors in the United States for 2023 (E)
Table 38: USA Recent Past, Current & Future Analysis for Drug
Discovery Services by Type - Medicinal Chemistry Services,
Biology Services and Drug Metabolism & Pharmacokinetics -
Independent Analysis of Annual Sales in US$ Million for the
Years 2022 through 2030 and % CAGR
Table 39: USA Historic Review for Drug Discovery Services by
Type - Medicinal Chemistry Services, Biology Services and Drug
Metabolism & Pharmacokinetics Markets - Independent Analysis of
Annual Sales in US$ Million for Years 2012 through 2021 and %
CAGR
Table 40: USA 18-Year Perspective for Drug Discovery Services
by Type - Percentage Breakdown of Value Sales for Medicinal
Chemistry Services, Biology Services and Drug Metabolism &
Pharmacokinetics for the Years 2012, 2023 & 2030
Table 41: USA Recent Past, Current & Future Analysis for Drug
Discovery Services by Therapeutic Area - Cardiovascular
Diseases, Other Therapeutic Areas, Oncology, Neurology,
Infectious & Immune System Diseases and Digestive System
Diseases - Independent Analysis of Annual Sales in US$ Million
for the Years 2022 through 2030 and % CAGR
Table 42: USA Historic Review for Drug Discovery Services by
Therapeutic Area - Cardiovascular Diseases, Other Therapeutic
Areas, Oncology, Neurology, Infectious & Immune System Diseases
and Digestive System Diseases Markets - Independent Analysis of
Annual Sales in US$ Million for Years 2012 through 2021 and %
CAGR
Table 43: USA 18-Year Perspective for Drug Discovery Services
by Therapeutic Area - Percentage Breakdown of Value Sales for
Cardiovascular Diseases, Other Therapeutic Areas, Oncology,
Neurology, Infectious & Immune System Diseases and Digestive
System Diseases for the Years 2012, 2023 & 2030
Table 44: USA Recent Past, Current & Future Analysis for Drug
Discovery Services by Drug Type - Small Molecules and Biologics -
Independent Analysis of Annual Sales in US$ Million for the
Years 2022 through 2030 and % CAGR
Table 45: USA Historic Review for Drug Discovery Services by
Drug Type - Small Molecules and Biologics Markets - Independent
Analysis of Annual Sales in US$ Million for Years 2012 through
2021 and % CAGR
Table 46: USA 18-Year Perspective for Drug Discovery Services
by Drug Type - Percentage Breakdown of Value Sales for Small
Molecules and Biologics for the Years 2012, 2023 & 2030
CANADA
Table 47: Canada Recent Past, Current & Future Analysis for
Drug Discovery Services by Type - Medicinal Chemistry Services,
Biology Services and Drug Metabolism & Pharmacokinetics -
Independent Analysis of Annual Sales in US$ Million for the
Years 2022 through 2030 and % CAGR
Table 48: Canada Historic Review for Drug Discovery Services by
Type - Medicinal Chemistry Services, Biology Services and Drug
Metabolism & Pharmacokinetics Markets - Independent Analysis of
Annual Sales in US$ Million for Years 2012 through 2021 and %
CAGR
Table 49: Canada 18-Year Perspective for Drug Discovery
Services by Type - Percentage Breakdown of Value Sales for
Medicinal Chemistry Services, Biology Services and Drug
Metabolism & Pharmacokinetics for the Years 2012, 2023 & 2030
Table 50: Canada Recent Past, Current & Future Analysis for
Drug Discovery Services by Therapeutic Area - Cardiovascular
Diseases, Other Therapeutic Areas, Oncology, Neurology,
Infectious & Immune System Diseases and Digestive System
Diseases - Independent Analysis of Annual Sales in US$ Million
for the Years 2022 through 2030 and % CAGR
Table 51: Canada Historic Review for Drug Discovery Services by
Therapeutic Area - Cardiovascular Diseases, Other Therapeutic
Areas, Oncology, Neurology, Infectious & Immune System Diseases
and Digestive System Diseases Markets - Independent Analysis of
Annual Sales in US$ Million for Years 2012 through 2021 and %
CAGR
Table 52: Canada 18-Year Perspective for Drug Discovery
Services by Therapeutic Area - Percentage Breakdown of Value
Sales for Cardiovascular Diseases, Other Therapeutic Areas,
Oncology, Neurology, Infectious & Immune System Diseases and
Digestive System Diseases for the Years 2012, 2023 & 2030
Table 53: Canada Recent Past, Current & Future Analysis for
Drug Discovery Services by Drug Type - Small Molecules and
Biologics - Independent Analysis of Annual Sales in US$ Million
for the Years 2022 through 2030 and % CAGR
Table 54: Canada Historic Review for Drug Discovery Services by
Drug Type - Small Molecules and Biologics Markets - Independent
Analysis of Annual Sales in US$ Million for Years 2012 through
2021 and % CAGR
Table 55: Canada 18-Year Perspective for Drug Discovery
Services by Drug Type - Percentage Breakdown of Value Sales for
Small Molecules and Biologics for the Years 2012, 2023 & 2030
JAPAN
Drug Discovery Services Market Presence - Strong/Active/Niche/
Trivial - Key Competitors in Japan for 2023 (E)
Table 56: Japan Recent Past, Current & Future Analysis for Drug
Discovery Services by Type - Medicinal Chemistry Services,
Biology Services and Drug Metabolism & Pharmacokinetics -
Independent Analysis of Annual Sales in US$ Million for the
Years 2022 through 2030 and % CAGR
Table 57: Japan Historic Review for Drug Discovery Services by
Type - Medicinal Chemistry Services, Biology Services and Drug
Metabolism & Pharmacokinetics Markets - Independent Analysis of
Annual Sales in US$ Million for Years 2012 through 2021 and %
CAGR
Table 58: Japan 18-Year Perspective for Drug Discovery Services
by Type - Percentage Breakdown of Value Sales for Medicinal
Chemistry Services, Biology Services and Drug Metabolism &
Pharmacokinetics for the Years 2012, 2023 & 2030
Table 59: Japan Recent Past, Current & Future Analysis for Drug
Discovery Services by Therapeutic Area - Cardiovascular
Diseases, Other Therapeutic Areas, Oncology, Neurology,
Infectious & Immune System Diseases and Digestive System
Diseases - Independent Analysis of Annual Sales in US$ Million
for the Years 2022 through 2030 and % CAGR
Table 60: Japan Historic Review for Drug Discovery Services by
Therapeutic Area - Cardiovascular Diseases, Other Therapeutic
Areas, Oncology, Neurology, Infectious & Immune System Diseases
and Digestive System Diseases Markets - Independent Analysis of
Annual Sales in US$ Million for Years 2012 through 2021 and %
CAGR
Table 61: Japan 18-Year Perspective for Drug Discovery Services
by Therapeutic Area - Percentage Breakdown of Value Sales for
Cardiovascular Diseases, Other Therapeutic Areas, Oncology,
Neurology, Infectious & Immune System Diseases and Digestive
System Diseases for the Years 2012, 2023 & 2030
Table 62: Japan Recent Past, Current & Future Analysis for Drug
Discovery Services by Drug Type - Small Molecules and Biologics -
Independent Analysis of Annual Sales in US$ Million for the
Years 2022 through 2030 and % CAGR
Table 63: Japan Historic Review for Drug Discovery Services by
Drug Type - Small Molecules and Biologics Markets - Independent
Analysis of Annual Sales in US$ Million for Years 2012 through
2021 and % CAGR
Table 64: Japan 18-Year Perspective for Drug Discovery Services
by Drug Type - Percentage Breakdown of Value Sales for Small
Molecules and Biologics for the Years 2012, 2023 & 2030
CHINA
Drug Discovery Services Market Presence - Strong/Active/Niche/
Trivial - Key Competitors in China for 2023 (E)
Table 65: China Recent Past, Current & Future Analysis for Drug
Discovery Services by Type - Medicinal Chemistry Services,
Biology Services and Drug Metabolism & Pharmacokinetics -
Independent Analysis of Annual Sales in US$ Million for the
Years 2022 through 2030 and % CAGR
Table 66: China Historic Review for Drug Discovery Services by
Type - Medicinal Chemistry Services, Biology Services and Drug
Metabolism & Pharmacokinetics Markets - Independent Analysis of
Annual Sales in US$ Million for Years 2012 through 2021 and %
CAGR
Table 67: China 18-Year Perspective for Drug Discovery Services
by Type - Percentage Breakdown of Value Sales for Medicinal
Chemistry Services, Biology Services and Drug Metabolism &
Pharmacokinetics for the Years 2012, 2023 & 2030
Table 68: China Recent Past, Current & Future Analysis for Drug
Discovery Services by Therapeutic Area - Cardiovascular
Diseases, Other Therapeutic Areas, Oncology, Neurology,
Infectious & Immune System Diseases and Digestive System
Diseases - Independent Analysis of Annual Sales in US$ Million
for the Years 2022 through 2030 and % CAGR
Table 69: China Historic Review for Drug Discovery Services by
Therapeutic Area - Cardiovascular Diseases, Other Therapeutic
Areas, Oncology, Neurology, Infectious & Immune System Diseases
and Digestive System Diseases Markets - Independent Analysis of
Annual Sales in US$ Million for Years 2012 through 2021 and %
CAGR
Table 70: China 18-Year Perspective for Drug Discovery Services
by Therapeutic Area - Percentage Breakdown of Value Sales for
Cardiovascular Diseases, Other Therapeutic Areas, Oncology,
Neurology, Infectious & Immune System Diseases and Digestive
System Diseases for the Years 2012, 2023 & 2030
Table 71: China Recent Past, Current & Future Analysis for Drug
Discovery Services by Drug Type - Small Molecules and Biologics -
Independent Analysis of Annual Sales in US$ Million for the
Years 2022 through 2030 and % CAGR
Table 72: China Historic Review for Drug Discovery Services by
Drug Type - Small Molecules and Biologics Markets - Independent
Analysis of Annual Sales in US$ Million for Years 2012 through
2021 and % CAGR
Table 73: China 18-Year Perspective for Drug Discovery Services
by Drug Type - Percentage Breakdown of Value Sales for Small
Molecules and Biologics for the Years 2012, 2023 & 2030
EUROPE
Drug Discovery Services Market Presence - Strong/Active/Niche/
Trivial - Key Competitors in Europe for 2023 (E)
Table 74: Europe Recent Past, Current & Future Analysis for
Drug Discovery Services by Geographic Region - France, Germany,
Italy, UK, Spain, Russia and Rest of Europe Markets -
Independent Analysis of Annual Sales in US$ Million for Years
2022 through 2030 and % CAGR
Table 75: Europe Historic Review for Drug Discovery Services by
Geographic Region - France, Germany, Italy, UK, Spain, Russia
and Rest of Europe Markets - Independent Analysis of Annual
Sales in US$ Million for Years 2012 through 2021 and % CAGR
Table 76: Europe 18-Year Perspective for Drug Discovery
Services by Geographic Region - Percentage Breakdown of Value
Sales for France, Germany, Italy, UK, Spain, Russia and Rest of
Europe Markets for Years 2012, 2023 & 2030
Table 77: Europe Recent Past, Current & Future Analysis for
Drug Discovery Services by Type - Medicinal Chemistry Services,
Biology Services and Drug Metabolism & Pharmacokinetics -
Independent Analysis of Annual Sales in US$ Million for the
Years 2022 through 2030 and % CAGR
Table 78: Europe Historic Review for Drug Discovery Services by
Type - Medicinal Chemistry Services, Biology Services and Drug
Metabolism & Pharmacokinetics Markets - Independent Analysis of
Annual Sales in US$ Million for Years 2012 through 2021 and %
CAGR
Table 79: Europe 18-Year Perspective for Drug Discovery
Services by Type - Percentage Breakdown of Value Sales for
Medicinal Chemistry Services, Biology Services and Drug
Metabolism & Pharmacokinetics for the Years 2012, 2023 & 2030
Table 80: Europe Recent Past, Current & Future Analysis for
Drug Discovery Services by Therapeutic Area - Cardiovascular
Diseases, Other Therapeutic Areas, Oncology, Neurology,
Infectious & Immune System Diseases and Digestive System
Diseases - Independent Analysis of Annual Sales in US$ Million
for the Years 2022 through 2030 and % CAGR
Table 81: Europe Historic Review for Drug Discovery Services by
Therapeutic Area - Cardiovascular Diseases, Other Therapeutic
Areas, Oncology, Neurology, Infectious & Immune System Diseases
and Digestive System Diseases Markets - Independent Analysis of
Annual Sales in US$ Million for Years 2012 through 2021 and %
CAGR
Table 82: Europe 18-Year Perspective for Drug Discovery
Services by Therapeutic Area - Percentage Breakdown of Value
Sales for Cardiovascular Diseases, Other Therapeutic Areas,
Oncology, Neurology, Infectious & Immune System Diseases and
Digestive System Diseases for the Years 2012, 2023 & 2030
Table 83: Europe Recent Past, Current & Future Analysis for
Drug Discovery Services by Drug Type - Small Molecules and
Biologics - Independent Analysis of Annual Sales in US$ Million
for the Years 2022 through 2030 and % CAGR
Table 84: Europe Historic Review for Drug Discovery Services by
Drug Type - Small Molecules and Biologics Markets - Independent
Analysis of Annual Sales in US$ Million for Years 2012 through
2021 and % CAGR
Table 85: Europe 18-Year Perspective for Drug Discovery
Services by Drug Type - Percentage Breakdown of Value Sales for
Small Molecules and Biologics for the Years 2012, 2023 & 2030
FRANCE
Drug Discovery Services Market Presence - Strong/Active/Niche/
Trivial - Key Competitors in France for 2023 (E)
Table 86: France Recent Past, Current & Future Analysis for
Drug Discovery Services by Type - Medicinal Chemistry Services,
Biology Services and Drug Metabolism & Pharmacokinetics -
Independent Analysis of Annual Sales in US$ Million for the
Years 2022 through 2030 and % CAGR
Table 87: France Historic Review for Drug Discovery Services by
Type - Medicinal Chemistry Services, Biology Services and Drug
Metabolism & Pharmacokinetics Markets - Independent Analysis of
Annual Sales in US$ Million for Years 2012 through 2021 and %
CAGR
Table 88: France 18-Year Perspective for Drug Discovery
Services by Type - Percentage Breakdown of Value Sales for
Medicinal Chemistry Services, Biology Services and Drug
Metabolism & Pharmacokinetics for the Years 2012, 2023 & 2030
Table 89: France Recent Past, Current & Future Analysis for
Drug Discovery Services by Therapeutic Area - Cardiovascular
Diseases, Other Therapeutic Areas, Oncology, Neurology,
Infectious & Immune System Diseases and Digestive System
Diseases - Independent Analysis of Annual Sales in US$ Million
for the Years 2022 through 2030 and % CAGR
Table 90: France Historic Review for Drug Discovery Services by
Therapeutic Area - Cardiovascular Diseases, Other Therapeutic
Areas, Oncology, Neurology, Infectious & Immune System Diseases
and Digestive System Diseases Markets - Independent Analysis of
Annual Sales in US$ Million for Years 2012 through 2021 and %
CAGR
Table 91: France 18-Year Perspective for Drug Discovery
Services by Therapeutic Area - Percentage Breakdown of Value
Sales for Cardiovascular Diseases, Other Therapeutic Areas,
Oncology, Neurology, Infectious & Immune System Diseases and
Digestive System Diseases for the Years 2012, 2023 & 2030
Table 92: France Recent Past, Current & Future Analysis for
Drug Discovery Services by Drug Type - Small Molecules and
Biologics - Independent Analysis of Annual Sales in US$ Million
for the Years 2022 through 2030 and % CAGR
Table 93: France Historic Review for Drug Discovery Services by
Drug Type - Small Molecules and Biologics Markets - Independent
Analysis of Annual Sales in US$ Million for Years 2012 through
2021 and % CAGR
Table 94: France 18-Year Perspective for Drug Discovery
Services by Drug Type - Percentage Breakdown of Value Sales for
Small Molecules and Biologics for the Years 2012, 2023 & 2030
GERMANY
Drug Discovery Services Market Presence - Strong/Active/Niche/
Trivial - Key Competitors in Germany for 2023 (E)
Table 95: Germany Recent Past, Current & Future Analysis for
Drug Discovery Services by Type - Medicinal Chemistry Services,
Biology Services and Drug Metabolism & Pharmacokinetics -
Independent Analysis of Annual Sales in US$ Million for the
Years 2022 through 2030 and % CAGR
Table 96: Germany Historic Review for Drug Discovery Services
by Type - Medicinal Chemistry Services, Biology Services and
Drug Metabolism & Pharmacokinetics Markets - Independent
Analysis of Annual Sales in US$ Million for Years 2012 through
2021 and % CAGR
Table 97: Germany 18-Year Perspective for Drug Discovery
Services by Type - Percentage Breakdown of Value Sales for
Medicinal Chemistry Services, Biology Services and Drug
Metabolism & Pharmacokinetics for the Years 2012, 2023 & 2030
Table 98: Germany Recent Past, Current & Future Analysis for
Drug Discovery Services by Therapeutic Area - Cardiovascular
Diseases, Other Therapeutic Areas, Oncology, Neurology,
Infectious & Immune System Diseases and Digestive System
Diseases - Independent Analysis of Annual Sales in US$ Million
for the Years 2022 through 2030 and % CAGR
Table 99: Germany Historic Review for Drug Discovery Services
by Therapeutic Area - Cardiovascular Diseases, Other
Therapeutic Areas, Oncology, Neurology, Infectious & Immune
System Diseases and Digestive System Diseases Markets -
Independent Analysis of Annual Sales in US$ Million for Years
2012 through 2021 and % CAGR
Table 100: Germany 18-Year Perspective for Drug Discovery
Services by Therapeutic Area - Percentage Breakdown of Value
Sales for Cardiovascular Diseases, Other Therapeutic Areas,
Oncology, Neurology, Infectious & Immune System Diseases and
Digestive System Diseases for the Years 2012, 2023 & 2030
Table 101: Germany Recent Past, Current & Future Analysis for
Drug Discovery Services by Drug Type - Small Molecules and
Biologics - Independent Analysis of Annual Sales in US$ Million
for the Years 2022 through 2030 and % CAGR
Table 102: Germany Historic Review for Drug Discovery Services
by Drug Type - Small Molecules and Biologics Markets -
Independent Analysis of Annual Sales in US$ Million for Years
2012 through 2021 and % CAGR
Table 103: Germany 18-Year Perspective for Drug Discovery
Services by Drug Type - Percentage Breakdown of Value Sales for
Small Molecules and Biologics for the Years 2012, 2023 & 2030
ITALY
Table 104: Italy Recent Past, Current & Future Analysis for
Drug Discovery Services by Type - Medicinal Chemistry Services,
Biology Services and Drug Metabolism & Pharmacokinetics -
Independent Analysis of Annual Sales in US$ Million for the
Years 2022 through 2030 and % CAGR
Table 105: Italy Historic Review for Drug Discovery Services by
Type - Medicinal Chemistry Services, Biology Services and Drug
Metabolism & Pharmacokinetics Markets - Independent Analysis of
Annual Sales in US$ Million for Years 2012 through 2021 and %
CAGR
Table 106: Italy 18-Year Perspective for Drug Discovery
Services by Type - Percentage Breakdown of Value Sales for
Medicinal Chemistry Services, Biology Services and Drug
Metabolism & Pharmacokinetics for the Years 2012, 2023 & 2030
Table 107: Italy Recent Past, Current & Future Analysis for
Drug Discovery Services by Therapeutic Area - Cardiovascular
Diseases, Other Therapeutic Areas, Oncology, Neurology,
Infectious & Immune System Diseases and Digestive System
Diseases - Independent Analysis of Annual Sales in US$ Million
for the Years 2022 through 2030 and % CAGR
Table 108: Italy Historic Review for Drug Discovery Services by
Therapeutic Area - Cardiovascular Diseases, Other Therapeutic
Areas, Oncology, Neurology, Infectious & Immune System Diseases
and Digestive System Diseases Markets - Independent Analysis of
Annual Sales in US$ Million for Years 2012 through 2021 and %
CAGR
Table 109: Italy 18-Year Perspective for Drug Discovery
Services by Therapeutic Area - Percentage Breakdown of Value
Sales for Cardiovascular Diseases, Other Therapeutic Areas,
Oncology, Neurology, Infectious & Immune System Diseases and
Digestive System Diseases for the Years 2012, 2023 & 2030
Table 110: Italy Recent Past, Current & Future Analysis for
Drug Discovery Services by Drug Type - Small Molecules and
Biologics - Independent Analysis of Annual Sales in US$ Million
for the Years 2022 through 2030 and % CAGR
Table 111: Italy Historic Review for Drug Discovery Services by
Drug Type - Small Molecules and Biologics Markets - Independent
Analysis of Annual Sales in US$ Million for Years 2012 through
2021 and % CAGR
Table 112: Italy 18-Year Perspective for Drug Discovery
Services by Drug Type - Percentage Breakdown of Value Sales for
Small Molecules and Biologics for the Years 2012, 2023 & 2030
UNITED KINGDOM
Drug Discovery Services Market Presence - Strong/Active/Niche/
Trivial - Key Competitors in the United Kingdom for 2023 (E)
Table 113: UK Recent Past, Current & Future Analysis for Drug
Discovery Services by Type - Medicinal Chemistry Services,
Biology Services and Drug Metabolism & Pharmacokinetics -
Independent Analysis of Annual Sales in US$ Million for the
Years 2022 through 2030 and % CAGR
Table 114: UK Historic Review for Drug Discovery Services by
Type - Medicinal Chemistry Services, Biology Services and Drug
Metabolism & Pharmacokinetics Markets - Independent Analysis of
Annual Sales in US$ Million for Years 2012 through 2021 and %
CAGR
Table 115: UK 18-Year Perspective for Drug Discovery Services
by Type - Percentage Breakdown of Value Sales for Medicinal
Chemistry Services, Biology Services and Drug Metabolism &
Pharmacokinetics for the Years 2012, 2023 & 2030
Table 116: UK Recent Past, Current & Future Analysis for Drug
Discovery Services by Therapeutic Area - Cardiovascular
Diseases, Other Therapeutic Areas, Oncology, Neurology,
Infectious & Immune System Diseases and Digestive System
Please contact our Customer Support Center to get the complete Table of Contents
Read the full report: https://www.reportlinker.com/p06031398/?utm_source=PRN
About Reportlinker
ReportLinker is an award-winning market research solution. Reportlinker finds and organizes the latest industry data so you get all the market research you need - instantly, in one place.
Contact Clare: [email protected]
US: (339)-368-6001
Intl: +1 339-368-6001
SOURCE Reportlinker
更多内容,请访问原始网站
文中所述内容并不反映新药情报库及其所属公司任何意见及观点,如有版权侵扰或错误之处,请及时联系我们,我们会在24小时内配合处理。
机构
靶点
-药物
热门报告


立即开始免费试用!
智慧芽新药情报库是智慧芽专为生命科学人士构建的基于AI的创新药情报平台,助您全方位提升您的研发与决策效率。
立即开始数据试用!
智慧芽新药库数据也通过智慧芽数据服务平台,以API或者数据包形式对外开放,助您更加充分利用智慧芽新药情报信息。