Digestive Health Supplements to grow by USD 7.86 billion from 2022 to 2027|Growing awareness about digestive health drives the market - Technavio
2023-07-24
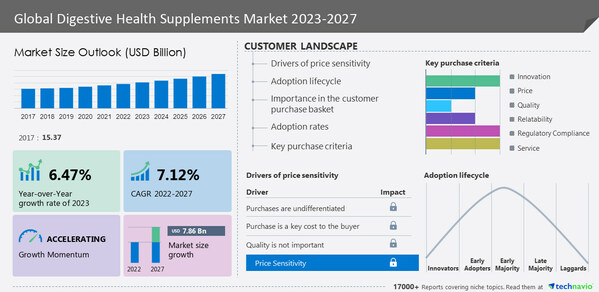
NEW YORK, July 24, 2023 /PRNewswire/ -- The
digestive health supplements market is set to grow by
USD 7.86 billion from 2022 to 2027, progressing at a
CAGR of 7.12% during the forecast period. The report offers an up-to-date analysis regarding the current global market scenario, the latest trends and drivers, and the overall market environment.
Growing awareness about digestive health is the major factor notably driving market growth. Consumers are becoming more aware of the importance of digestive health and its impact on overall health and well-being. Many health problems can result from poor digestive health, including digestive disorders, autoimmune diseases, and even mental health issues. As people seek all-natural ways to support their health, the demand for digestive supplements is on the rise. The global digestive health supplement market is largely driven by the growing awareness regarding digestive health and the impact of digestive health on overall health. Probiotics, prebiotics, and digestive enzymes, amongst other organic ingredients that can improve gut health and treat digestive issues, are becoming popular among consumers as dietary supplements. Consumers are expected to prioritize their digestive health and opt for natural methods to enhance it. Henceforth, owing to the increase in awareness, the market in focus will grow during the forecast period.
Here is an Exclusive report talking about Market scenarios with a historical period (2017-2021) and forecast period (2023-2027). Download Sample Report in minutes!
Continue Reading
Preview
来源: PRNewswire
Technavio has announced its latest market research report titled Global Digestive Health Supplements Market 2023-2027
The digestive health supplements market covers the following areas:
Digestive Health Supplements Market Sizing
Digestive Health Supplements Market Forecast
Digestive Health Supplements Market Analysis.
Digestive Health Supplements Market 2023-2027 - Market Dynamics
Significant Digestive Health Supplements Market Trends
The increasing popularity of probiotics and prebiotics is an emerging trend supporting market growth. A significant trend in the global digestive supplement market is the increasing significance of probiotics and prebiotics. Probiotics consist of live microorganisms that offer digestive and gut health benefits, while prebiotics are dietary fibers that contain beneficial bacteria. These ingredients are widely incorporated in digestive supplements due to their ability to promote a healthy gut microbiome and address common digestive issues like bloating, gas, and constipation. Moreover, research has linked a healthy gut microbiome to overall well-being, including immune function, mental health, and weight management. The demand for digestive health supplements that include probiotics and prebiotics is driven by consumers seeking to support their gut health. Market players are also investing in research and development to develop specialized and more effective compositions of probiotics and prebiotics for treating digestive problems. These factors contribute to the growing demand for digestive health supplements in the market.
Major Digestive Health Supplements Market Challenge
Increasing pricing pressures are the significant challenge hindering market growth. One of the major challenges in the global digestive health supplement market is the limited consumer awareness regarding the benefits of these supplements. Despite the growing popularity of these products, many consumers remain unaware of the advantages they offer. This lack of awareness can result in reduced demand as consumers may be hesitant to invest in premium products without understanding their potential benefits. Moreover, the lack of awareness can create uncertainty among consumers about the reliability and safety of digestive health supplements, further impacting their confidence in using such products. To address this challenge, market participants need to allocate resources to educational and awareness campaigns that aim to inform consumers about the advantages of these supplements. By enhancing consumer understanding, the market can overcome the obstacle of limited awareness and foster growth during the forecast period.
What's New? -
Special coverage on the Russia-Ukraine war; global inflation; recovery analysis from COVID-19; supply chain disruptions, global trade tensions; and risk of recession
Global competitiveness and key competitor positions
Market presence across multiple geographical footprints - Strong/Active/Niche/Trivial -
Buy the report!
Digestive Health Supplements Market 2023-2027: Market Segmentation
This digestive health supplements market report extensively covers
market segmentation by distribution channel (offline and online), type (prebiotics, probiotics, digestive enzymes, and others), and geography (North America, Europe, Asia, and the Rest of the World (ROW)).
The market share growth by the
offline segment will be significant during the forecast period. Offline distribution channel includes retail outlets, drug stores and pharmacies, and supermarkets. The offline distribution channel contributes to a more significant share of sales compared with online distribution channels. In developing countries such as India, China, and Brazil, consumers prefer to buy digestive health supplements from pharmacies or drug stores with prior consultation from healthcare practitioners or dieticians. The market share growth by the
offline segment will be significant during the forecast period. Offline distribution channel includes retail outlets, drug stores and pharmacies, and supermarkets. The offline distribution channel contributes to a more significant share of sales compared with online distribution channels. In developing countries such as India, China, and Brazil, consumers prefer to buy digestive health supplements from pharmacies or drug stores with prior consultation from healthcare practitioners or dieticians.
Companies Mentioned
Danone SA
GNC Holdings LLC
HealthForce SuperFoods Inc.
Organic India
Zenwise LLC
Haleon Plc
Vendors Offerings
Amway Corp. - The company offers digestive health supplements such as Nutrilite digestive enzyme.
Bayer AG - The company offers digestive health supplements such as Rennie.
Danone SA - The company offers digestive health supplements through its subsidiary Nutricia.
Gain instant access to 17,000+ market research reports.
Technavio's SUBSCRIPTION platform
Related Reports:
The
Europe nutrition supplements market size is projected to increase by USD 20.93 billion and the market is estimated to grow at a CAGR of 5.74% between 2022 and 2027. This report extensively covers market segmentation by distribution channel (offline and online), and type (vitamins, botanicals, proteins and amino acids, minerals, and others). Increasing demand for plant-based supplements is a key trend driving the nutrition supplements market in Europe.
The
vegan supplements market share is expected to increase to USD 3.43 billion from 2021 to 2026, and the market's growth momentum will accelerate at a CAGR of 8.1%. This report extensively covers vegan supplements market segmentation by distribution channel (offline and online) and geography (Europe, North America, APAC, South America, and the Middle East and Africa). One of the key factors driving growth in the vegan supplements market is the expanding global vegan population base.
Key Topics Covered:
1 Executive Summary
1.1 Market overview
Exhibit 01: Executive Summary – Chart on Market Overview
Exhibit 02: Executive Summary – Data Table on Market Overview
Exhibit 03: Executive Summary – Chart on Global Market Characteristics
Exhibit 04: Executive Summary – Chart on Market by Geography
Exhibit 05: Executive Summary – Chart on Market Segmentation by Distribution Channel
Exhibit 06: Executive Summary – Chart on Market Segmentation by Type
Exhibit 07: Executive Summary – Chart on Incremental Growth
Exhibit 08: Executive Summary – Data Table on Incremental Growth
Exhibit 09: Executive Summary – Chart on Vendor Market Positioning
2 Market Landscape
2.1 Market ecosystem
Exhibit 10: Parent market
Exhibit 11: Market Characteristics
3 Market Sizing
3.1 Market definition
Exhibit 12: Offerings of vendors included in the market definition
3.2 Market segment analysis
Exhibit 13: Market segments
3.3 Market size 2022
3.4 Market outlook: Forecast for 2022-2027
Exhibit 14: Chart on Global - Market size and forecast 2022-2027 ($ billion)
Exhibit 15: Data Table on Global - Market size and forecast 2022-2027 ($ billion)
Exhibit 16: Chart on Global Market: Year-over-year growth 2022-2027 (%)
Exhibit 17: Data Table on Global Market: Year-over-year growth 2022-2027 (%)
4 Historic Market Size
4.1 Global digestive health supplements market 2017 - 2021
Exhibit 18: Historic Market Size – Data Table on Global digestive health supplements market 2017 - 2021 ($ billion)
4.2 Distribution Channel Segment Analysis 2017 - 2021
Exhibit 19: Historic Market Size – Distribution Channel Segment 2017 - 2021 ($ billion)
4.3 Type Segment Analysis 2017 - 2021
Exhibit 20: Historic Market Size – Type Segment 2017 - 2021 ($ billion)
4.4 Geography Segment Analysis 2017 - 2021
Exhibit 21: Historic Market Size – Geography Segment 2017 - 2021 ($ billion)
4.5 Country Segment Analysis 2017 - 2021
Exhibit 22: Historic Market Size – Country Segment 2017 - 2021 ($ billion)
5 Five Forces Analysis
5.1 Five forces summary
Exhibit 23: Five forces analysis - Comparison between 2022 and 2027
5.2 Bargaining power of buyers
Exhibit 24: Chart on Bargaining power of buyers – Impact of key factors 2022 and 2027
5.3 Bargaining power of suppliers
Exhibit 25: Bargaining power of suppliers – Impact of key factors in 2022 and 2027
5.4 Threat of new entrants
Exhibit 26: Threat of new entrants – Impact of key factors in 2022 and 2027
5.5 Threat of substitutes
Exhibit 27: Threat of substitutes – Impact of key factors in 2022 and 2027
5.6 Threat of rivalry
Exhibit 28: Threat of rivalry – Impact of key factors in 2022 and 2027
5.7 Market condition
Exhibit 29: Chart on Market condition - Five forces 2022 and 2027
6 Market Segmentation by Distribution Channel
6.1 Market segments
Exhibit 30: Chart on Distribution Channel - Market share 2022-2027 (%)
Exhibit 31: Data Table on Distribution Channel - Market share 2022-2027 (%)
6.2 Comparison by Distribution Channel
Exhibit 32: Chart on Comparison by Distribution Channel
Exhibit 33: Data Table on Comparison by Distribution Channel
6.3 Offline - Market size and forecast 2022-2027
Exhibit 34: Chart on Offline - Market size and forecast 2022-2027 ($ billion)
Exhibit 35: Data Table on Offline - Market size and forecast 2022-2027 ($ billion)
Exhibit 36: Chart on Offline - Year-over-year growth 2022-2027 (%)
Exhibit 37: Data Table on Offline - Year-over-year growth 2022-2027 (%)
6.4 Online - Market size and forecast 2022-2027
Exhibit 38: Chart on Online - Market size and forecast 2022-2027 ($ billion)
Exhibit 39: Data Table on Online - Market size and forecast 2022-2027 ($ billion)
Exhibit 40: Chart on Online - Year-over-year growth 2022-2027 (%)
Exhibit 41: Data Table on Online - Year-over-year growth 2022-2027 (%)
6.5 Market opportunity by Distribution Channel
Exhibit 42: Market opportunity by Distribution Channel ($ billion)
Exhibit 43: Data Table on Market opportunity by Distribution Channel ($ billion)
7 Market Segmentation by Type
7.1 Market segments
Exhibit 44: Chart on Type - Market share 2022-2027 (%)
Exhibit 45: Data Table on Type - Market share 2022-2027 (%)
7.2 Comparison by Type
Exhibit 46: Chart on Comparison by Type
Exhibit 47: Data Table on Comparison by Type
7.3 Prebiotics - Market size and forecast 2022-2027
Exhibit 48: Chart on Prebiotics - Market size and forecast 2022-2027 ($ billion)
Exhibit 49: Data Table on Prebiotics - Market size and forecast 2022-2027 ($ billion)
Exhibit 50: Chart on Prebiotics - Year-over-year growth 2022-2027 (%)
Exhibit 51: Data Table on Prebiotics - Year-over-year growth 2022-2027 (%)
7.4 Probiotics - Market size and forecast 2022-2027
Exhibit 52: Chart on Probiotics - Market size and forecast 2022-2027 ($ billion)
Exhibit 53: Data Table on Probiotics - Market size and forecast 2022-2027 ($ billion)
Exhibit 54: Chart on Probiotics - Year-over-year growth 2022-2027 (%)
Exhibit 55: Data Table on Probiotics - Year-over-year growth 2022-2027 (%)
7.5 Digestive enzymes - Market size and forecast 2022-2027
Exhibit 56: Chart on Digestive enzymes - Market size and forecast 2022-2027 ($ billion)
Exhibit 57: Data Table on Digestive enzymes - Market size and forecast 2022-2027 ($ billion)
Exhibit 58: Chart on Digestive enzymes - Year-over-year growth 2022-2027 (%)
Exhibit 59: Data Table on Digestive enzymes - Year-over-year growth 2022-2027 (%)
7.6 Others - Market size and forecast 2022-2027
Exhibit 60: Chart on Others - Market size and forecast 2022-2027 ($ billion)
Exhibit 61: Data Table on Others - Market size and forecast 2022-2027 ($ billion)
Exhibit 62: Chart on Others - Year-over-year growth 2022-2027 (%)
Exhibit 63: Data Table on Others - Year-over-year growth 2022-2027 (%)
7.7 Market opportunity by Type
Exhibit 64: Market opportunity by Type ($ billion)
Exhibit 65: Data Table on Market opportunity by Type ($ billion)
8 Customer Landscape
8.1 Customer landscape overview
Exhibit 66: Analysis of price sensitivity, lifecycle, customer purchase basket, adoption rates, and purchase criteria
9 Geographic Landscape
9.1 Geographic segmentation
Exhibit 67: Chart on Market share by geography 2022-2027 (%)
Exhibit 68: Data Table on Market share by geography 2022-2027 (%)
9.2 Geographic comparison
Exhibit 69: Chart on Geographic comparison
Exhibit 70: Data Table on Geographic comparison
9.3 North America - Market size and forecast 2022-2027
Exhibit 71: Chart on North America - Market size and forecast 2022-2027 ($ billion)
Exhibit 72: Data Table on North America - Market size and forecast 2022-2027 ($ billion)
Exhibit 73: Chart on North America - Year-over-year growth 2022-2027 (%)
Exhibit 74: Data Table on North America - Year-over-year growth 2022-2027 (%)
9.4 Europe - Market size and forecast 2022-2027
Exhibit 75: Chart on Europe - Market size and forecast 2022-2027 ($ billion)
Exhibit 76: Data Table on Europe - Market size and forecast 2022-2027 ($ billion)
Exhibit 77: Chart on Europe - Year-over-year growth 2022-2027 (%)
Exhibit 78: Data Table on Europe - Year-over-year growth 2022-2027 (%)
9.5 Asia - Market size and forecast 2022-2027
Exhibit 79: Chart on Asia - Market size and forecast 2022-2027 ($ billion)
Exhibit 80: Data Table on Asia - Market size and forecast 2022-2027 ($ billion)
Exhibit 81: Chart on Asia - Year-over-year growth 2022-2027 (%)
Exhibit 82: Data Table on Asia - Year-over-year growth 2022-2027 (%)
9.6 Rest of World (ROW) - Market size and forecast 2022-2027
Exhibit 83: Chart on Rest of World (ROW) - Market size and forecast 2022-2027 ($ billion)
Exhibit 84: Data Table on Rest of World (ROW) - Market size and forecast 2022-2027 ($ billion)
Exhibit 85: Chart on Rest of World (ROW) - Year-over-year growth 2022-2027 (%)
Exhibit 86: Data Table on Rest of World (ROW) - Year-over-year growth 2022-2027 (%)
9.7 US - Market size and forecast 2022-2027
Exhibit 87: Chart on US - Market size and forecast 2022-2027 ($ billion)
Exhibit 88: Data Table on US - Market size and forecast 2022-2027 ($ billion)
Exhibit 89: Chart on US - Year-over-year growth 2022-2027 (%)
Exhibit 90: Data Table on US - Year-over-year growth 2022-2027 (%)
9.8 China - Market size and forecast 2022-2027
Exhibit 91: Chart on China - Market size and forecast 2022-2027 ($ billion)
Exhibit 92: Data Table on China - Market size and forecast 2022-2027 ($ billion)
Exhibit 93: Chart on China - Year-over-year growth 2022-2027 (%)
Exhibit 94: Data Table on China - Year-over-year growth 2022-2027 (%)
9.9 UK - Market size and forecast 2022-2027
Exhibit 95: Chart on UK - Market size and forecast 2022-2027 ($ billion)
Exhibit 96: Data Table on UK - Market size and forecast 2022-2027 ($ billion)
Exhibit 97: Chart on UK - Year-over-year growth 2022-2027 (%)
Exhibit 98: Data Table on UK - Year-over-year growth 2022-2027 (%)
9.10 Germany - Market size and forecast 2022-2027
Exhibit 99: Chart on Germany - Market size and forecast 2022-2027 ($ billion)
Exhibit 100: Data Table on Germany - Market size and forecast 2022-2027 ($ billion)
Exhibit 101: Chart on Germany - Year-over-year growth 2022-2027 (%)
Exhibit 102: Data Table on Germany - Year-over-year growth 2022-2027 (%)
9.11 Japan - Market size and forecast 2022-2027
Exhibit 103: Chart on Japan - Market size and forecast 2022-2027 ($ billion)
Exhibit 104: Data Table on Japan - Market size and forecast 2022-2027 ($ billion)
Exhibit 105: Chart on Japan - Year-over-year growth 2022-2027 (%)
Exhibit 106: Data Table on Japan - Year-over-year growth 2022-2027 (%)
9.12 Market opportunity by geography
Exhibit 107: Market opportunity by geography ($ billion)
Exhibit 108: Data Tables on Market opportunity by geography ($ billion)
10 Drivers, Challenges, and Trends
10.1 Market drivers
10.2 Market challenges
10.3 Impact of drivers and challenges
Exhibit 109: Impact of drivers and challenges in 2022 and 2027
10.4 Market trends
11 Vendor Landscape
11.1 Overview
11.2 Vendor landscape
Exhibit 110: Overview on Criticality of inputs and Factors of differentiation
11.3 Landscape disruption
Exhibit 111: Overview on factors of disruption
11.4 Industry risks
Exhibit 112: Impact of key risks on business
12 Vendor Analysis
12.1 Vendors covered
Exhibit 113: Vendors covered
12.2 Market positioning of vendors
Exhibit 114: Matrix on vendor position and classification
12.3 Amway Corp.
Exhibit 115: Amway Corp. - Overview
Exhibit 116: Amway Corp. - Product / Service
Exhibit 117: Amway Corp. - Key offerings
12.4 Bayer AG
Exhibit 118: Bayer AG - Overview
Exhibit 119: Bayer AG - Business segments
Exhibit 120: Bayer AG - Key news
Exhibit 121: Bayer AG - Key offerings
Exhibit 122: Bayer AG - Segment focus
12.5 Danone SA
Exhibit 123: Danone SA - Overview
Exhibit 124: Danone SA - Business segments
Exhibit 125: Danone SA - Key news
Exhibit 126: Danone SA - Key offerings
Exhibit 127: Danone SA - Segment focus
12.6 Haleon Plc
Exhibit 128: Haleon Plc - Overview
Exhibit 129: Haleon Plc - Product / Service
Exhibit 130: Haleon Plc - Key offerings
Exhibit 131: Hamari Chemicals Ltd. - Overview
Exhibit 132: Hamari Chemicals Ltd. - Product / Service
Exhibit 133: Hamari Chemicals Ltd. - Key offerings
12.8 HealthForce SuperFoods Inc.
Exhibit 134: HealthForce SuperFoods Inc. - Overview
Exhibit 135: HealthForce SuperFoods Inc. - Product / Service
Exhibit 136: HealthForce SuperFoods Inc. - Key offerings
Exhibit 137: Herbalife International of America Inc. - Overview
Exhibit 138: Herbalife International of America Inc. - Product / Service
Exhibit 139: Herbalife International of America Inc. - Key offerings
12.10 Koninklijke DSM NV
Exhibit 140: Koninklijke DSM NV - Overview
Exhibit 141: Koninklijke DSM NV - Business segments
Exhibit 142: Koninklijke DSM NV - Key news
Exhibit 143: Koninklijke DSM NV - Key offerings
Exhibit 144: Koninklijke DSM NV - Segment focus
12.11 Lonza Group Ltd.
Exhibit 145: Lonza Group Ltd. - Overview
Exhibit 146: Lonza Group Ltd. - Business segments
Exhibit 147: Lonza Group Ltd. - Key news
Exhibit 148: Lonza Group Ltd. - Key offerings
Exhibit 149: Lonza Group Ltd. - Segment focus
12.12 Nestle SA
Exhibit 150: Nestle SA - Overview
Exhibit 151: Nestle SA - Business segments
Exhibit 152: Nestle SA - Key news
Exhibit 153: Nestle SA - Key offerings
Exhibit 154: Nestle SA - Segment focus
12.13 Novozymes AS
Exhibit 155: Novozymes AS - Overview
Exhibit 156: Novozymes AS - Business segments
Exhibit 157: Novozymes AS - Key news
Exhibit 158: Novozymes AS - Key offerings
Exhibit 159: Novozymes AS - Segment focus
12.14 NOW Health Group Inc.
Exhibit 160: NOW Health Group Inc. - Overview
Exhibit 161: NOW Health Group Inc. - Product / Service
Exhibit 162: NOW Health Group Inc. - Key offerings
12.15 Pfizer Inc.
Exhibit 163: Pfizer Inc. - Overview
Exhibit 164: Pfizer Inc. - Product / Service
Exhibit 165: Pfizer Inc. - Key news
Exhibit 166: Pfizer Inc. - Key offerings
12.16 Unilever PLC
Exhibit 167: Unilever PLC - Overview
Exhibit 168: Unilever PLC - Business segments
Exhibit 169: Unilever PLC - Key news
Exhibit 170: Unilever PLC - Key offerings
Exhibit 171: Unilever PLC - Segment focus
12.17 Zenwise LLC
Exhibit 172: Zenwise LLC - Overview
Exhibit 173: Zenwise LLC - Product / Service
Exhibit 174: Zenwise LLC - Key offerings
13 Appendix
13.1 Scope of the report
13.2 Inclusions and exclusions checklist
Exhibit 175: Inclusions checklist
Exhibit 176: Exclusions checklist
13.3 Currency conversion rates for US$
Exhibit 177: Currency conversion rates for US$
13.4 Research methodology
Exhibit 178: Research methodology
Exhibit 179: Validation techniques employed for market sizing
Exhibit 180: Information sources
13.5 List of abbreviations
Exhibit 181: List of abbreviations
About Us
Technavio is a leading global technology research and advisory company. Their research and analysis focuses on emerging market trends and provides actionable insights to help businesses identify market opportunities and develop effective strategies to optimize their market positions. With over 500 specialized analysts, Technavio's report library consists of more than 17,000 reports and counting, covering 800 technologies, spanning across 50 countries. Their client base consists of enterprises of all sizes, including more than 100 Fortune 500 companies. This growing client base relies on Technavio's comprehensive coverage, extensive research, and actionable market insights to identify opportunities in existing and potential markets and assess their competitive positions within changing market scenarios.
Contact
Technavio Research
Jesse Maida
Media & Marketing Executive
US: +1 844 364 1100
UK: +44 203 893 3200
Email: [email protected]
Website: www.technavio.com
SOURCE Technavio
更多内容,请访问原始网站
文中所述内容并不反映新药情报库及其所属公司任何意见及观点,如有版权侵扰或错误之处,请及时联系我们,我们会在24小时内配合处理。
靶点
-热门报告


立即开始免费试用!
智慧芽新药情报库是智慧芽专为生命科学人士构建的基于AI的创新药情报平台,助您全方位提升您的研发与决策效率。
立即开始数据试用!
智慧芽新药库数据也通过智慧芽数据服务平台,以API或者数据包形式对外开放,助您更加充分利用智慧芽新药情报信息。