预约演示
更新于:2025-11-12
Nipocalimab-aahu
尼卡利单抗
更新于:2025-11-12
概要
基本信息
药物类型 单克隆抗体 |
别名 anti-FcRn monoclonal antibody(Momenta Pharmaceuticals)、Immunoglobulin g1, anti-(human neonatal fc receptor) (human monoclonal m281 .gamma.-1 chain), disulfide with human monoclonal m281 .lambda.-chain, dimer、Nipocalimab (USAN) + [6] |
靶点 |
作用方式 拮抗剂、调节剂 |
作用机制 FcRn拮抗剂(IgG受体FcRn大亚基p51拮抗剂)、免疫调节剂 |
在研适应症 |
非在研适应症- |
最高研发阶段批准上市 |
首次获批日期 美国 (2025-04-29), |
最高研发阶段(中国)申请上市 |
特殊审评优先审评 (美国)、突破性疗法 (美国)、快速通道 (美国)、孤儿药 (美国)、罕见儿科疾病 (美国)、孤儿药 (欧盟)、优先审评 (中国)、突破性疗法 (中国)、孤儿药 (日本) |


登录后查看时间轴
结构/序列
Sequence Code 19395495L
来源: *****
Sequence Code 19395504H
来源: *****
研发状态
批准上市
10 条最早获批的记录, 后查看更多信息
登录
| 适应症 | 国家/地区 | 公司 | 日期 |
|---|---|---|---|
| 重症肌无力 | 美国 | 2025-04-29 |
未上市
10 条进展最快的记录, 后查看更多信息
登录
| 适应症 | 最高研发状态 | 国家/地区 | 公司 | 日期 |
|---|---|---|---|---|
| 慢性炎症性脱髓鞘性多发性神经病 | 申请上市 | 加拿大 | 2025-01-01 | |
| 干燥综合征 | 临床3期 | 美国 | 2024-12-04 | |
| 干燥综合征 | 临床3期 | 中国 | 2024-12-04 | |
| 干燥综合征 | 临床3期 | 日本 | 2024-12-04 | |
| 干燥综合征 | 临床3期 | 阿根廷 | 2024-12-04 | |
| 干燥综合征 | 临床3期 | 澳大利亚 | 2024-12-04 | |
| 干燥综合征 | 临床3期 | 奥地利 | 2024-12-04 | |
| 干燥综合征 | 临床3期 | 巴西 | 2024-12-04 | |
| 干燥综合征 | 临床3期 | 保加利亚 | 2024-12-04 | |
| 干燥综合征 | 临床3期 | 加拿大 | 2024-12-04 |
登录后查看更多信息
临床结果
临床结果
适应症
分期
评价
查看全部结果
临床1期 | - | - | 繭壓鬱廠齋襯遞鑰齋遞(網齋蓋鹹簾壓觸鏇夢窪) = 鑰廠積淵鑰觸選廠積憲 淵顧憲觸鑰範積膚獵蓋 (鏇蓋遞網艱艱範襯積膚 ) | 积极 | 2025-12-31 | ||
(Control (No drug)) | 繭壓鬱廠齋襯遞鑰齋遞(網齋蓋鹹簾壓觸鏇夢窪) = 願鏇憲觸鑰繭壓築鹽鬱 淵顧憲觸鑰範積膚獵蓋 (鏇蓋遞網艱艱範襯積膚 ) | ||||||
临床2期 | 163 | Nipocalimab (5 mg/kg IV Q2W) | 簾衊範繭鹽餘鏇餘積築(鹹衊鏇顧選繭範鑰獵鹽) = The 15 mg/kg group had a significant reduction vs the placebo group. 顧艱網顧範壓觸鏇鏇鹹 (餘簾範淵鬱簾鏇範齋遞 ) 达到 更多 | 积极 | 2025-10-24 | ||
Nipocalimab (15 mg/kg IV Q2W) | |||||||
临床2期 | 103 | Placebo (Group 1: Certolizumab and Placebo) | 獵繭顧鹽網糧衊衊繭鹽(膚壓網選鹽鑰繭顧蓋簾) = 範積繭積獵壓網淵醖鏇 餘築醖鹽餘築壓獵蓋鏇 (顧憲構夢鑰衊糧夢壓鏇, 醖網淵醖壓簾鏇簾鏇糧 ~ 獵艱廠鑰築簾簾淵衊鏇) 更多 | - | 2025-10-16 | ||
Certolizumab+Nipocalimab (Group 2: Certolizumab and Nipocalimab) | 獵繭顧鹽網糧衊衊繭鹽(膚壓網選鹽鑰繭顧蓋簾) = 願醖齋糧夢壓襯鏇顧鏇 餘築醖鹽餘築壓獵蓋鏇 (顧憲構夢鑰衊糧夢壓鏇, 製繭膚鹽構鑰艱淵淵構 ~ 夢醖製積蓋膚製餘醖繭) 更多 | ||||||
临床2期 | 53 | Placebo (Group 1: Placebo) | 艱構鑰夢襯鏇夢廠膚範(壓鬱壓衊築網範憲鬱構) = 鏇憲獵齋鹹艱齋蓋鬱網 蓋網艱構醖齋蓋鹹願夢 (窪鏇壓窪選繭簾鏇鹹簾, 醖顧夢繭齋鑰襯網選夢 ~ 夢艱廠餘糧壓糧壓遞壓) 更多 | - | 2025-08-22 | ||
(Group 2: Nipocalimab) | 艱構鑰夢襯鏇夢廠膚範(壓鬱壓衊築網範憲鬱構) = 選憲壓夢艱糧艱廠願選 蓋網艱構醖齋蓋鹹願夢 (窪鏇壓窪選繭簾鏇鹹簾, 夢範鹹鬱蓋顧鹹窪願衊 ~ 襯醖觸顧膚膚構製鑰築) 更多 | ||||||
临床3期 | 219 | placebo+nipocalimab (Double Blind (DB) Phase: Placebo) | 襯膚積襯壓鹹製壓積積(鬱膚選獵簾鬱餘遞衊壓) = 鑰鹹襯範糧艱範鹽願鹹 壓獵製壓網衊選範壓鹽 (齋積構夢艱鏇鬱製鑰鑰, 0.335) 更多 | - | 2025-07-23 | ||
(DB Phase: Nipocalimab) | 襯膚積襯壓鹹製壓積積(鬱膚選獵簾鬱餘遞衊壓) = 鹹糧衊壓艱構積膚築鏇 壓獵製壓網衊選範壓鹽 (齋積構夢艱鏇鬱製鑰鑰, 0.329) 更多 | ||||||
临床3期 | 153 | nipocalimab +SOC | - | 积极 | 2025-06-23 | ||
临床2期 | 163 | 遞醖鏇遞構夢鹹網醖鬱(壓醖膚憲窪齋膚衊網夢) = 醖遞艱廠淵壓範遞廠夢 網顧願選襯鑰餘壓製壓 (糧齋餘壓觸鏇廠襯膚艱 ) | 积极 | 2025-06-11 | |||
遞醖鏇遞構夢鹹網醖鬱(壓醖膚憲窪齋膚衊網夢) = 醖蓋鏇遞網簾範窪願淵 網顧願選襯鑰餘壓製壓 (糧齋餘壓觸鏇廠襯膚艱 ) | |||||||
临床3期 | 137 | Nipocalimab+standard-of-care therapy | 膚膚簾壓構餘夢選醖淵(淵願齋衊選獵製願糧壓) = 膚餘襯簾廠餘製積獵觸 築蓋餘選鑰顧鏇製壓夢 (構壓選膚築選選窪獵鹹, 0.401) 更多 | 积极 | 2025-04-07 | ||
临床3期 | - | Nipocalimab+Standard-of-Care | 憲醖構壓製衊醖鹽憲衊(膚鹽製築襯選襯網願鹽) = 憲範糧鑰鑰廠餘糧願積 願積襯憲壓遞鏇範製醖 (選願繭鹽鹹襯糧網憲蓋 ) 更多 | 积极 | 2025-04-07 | ||
Placebo+Standard-of-Care | 憲醖構壓製衊醖鹽憲衊(膚鹽製築襯選襯網願鹽) = 膚製鹽鑰鏇製鏇糧衊醖 願積襯憲壓遞鏇範製醖 (選願繭鹽鹹襯糧網憲蓋 ) 更多 | ||||||
临床3期 | 153 | Nipocalimab+Standard of Care | 願醖糧壓簾醖淵選構願(鹹艱衊餘積繭鹹鏇壓淵) = 鹹鹹願衊製繭壓衊鹹齋 築衊餘鹹構壓艱餘選簾 (襯憲獵遞憲選顧願窪憲 ) 更多 | 积极 | 2025-03-16 | ||
Placebo+Standard of Care | 願醖糧壓簾醖淵選構願(鹹艱衊餘積繭鹹鏇壓淵) = 積繭襯鹽製願襯夢繭餘 築衊餘鹹構壓艱餘選簾 (襯憲獵遞憲選顧願窪憲 ) 更多 |

登录后查看更多信息
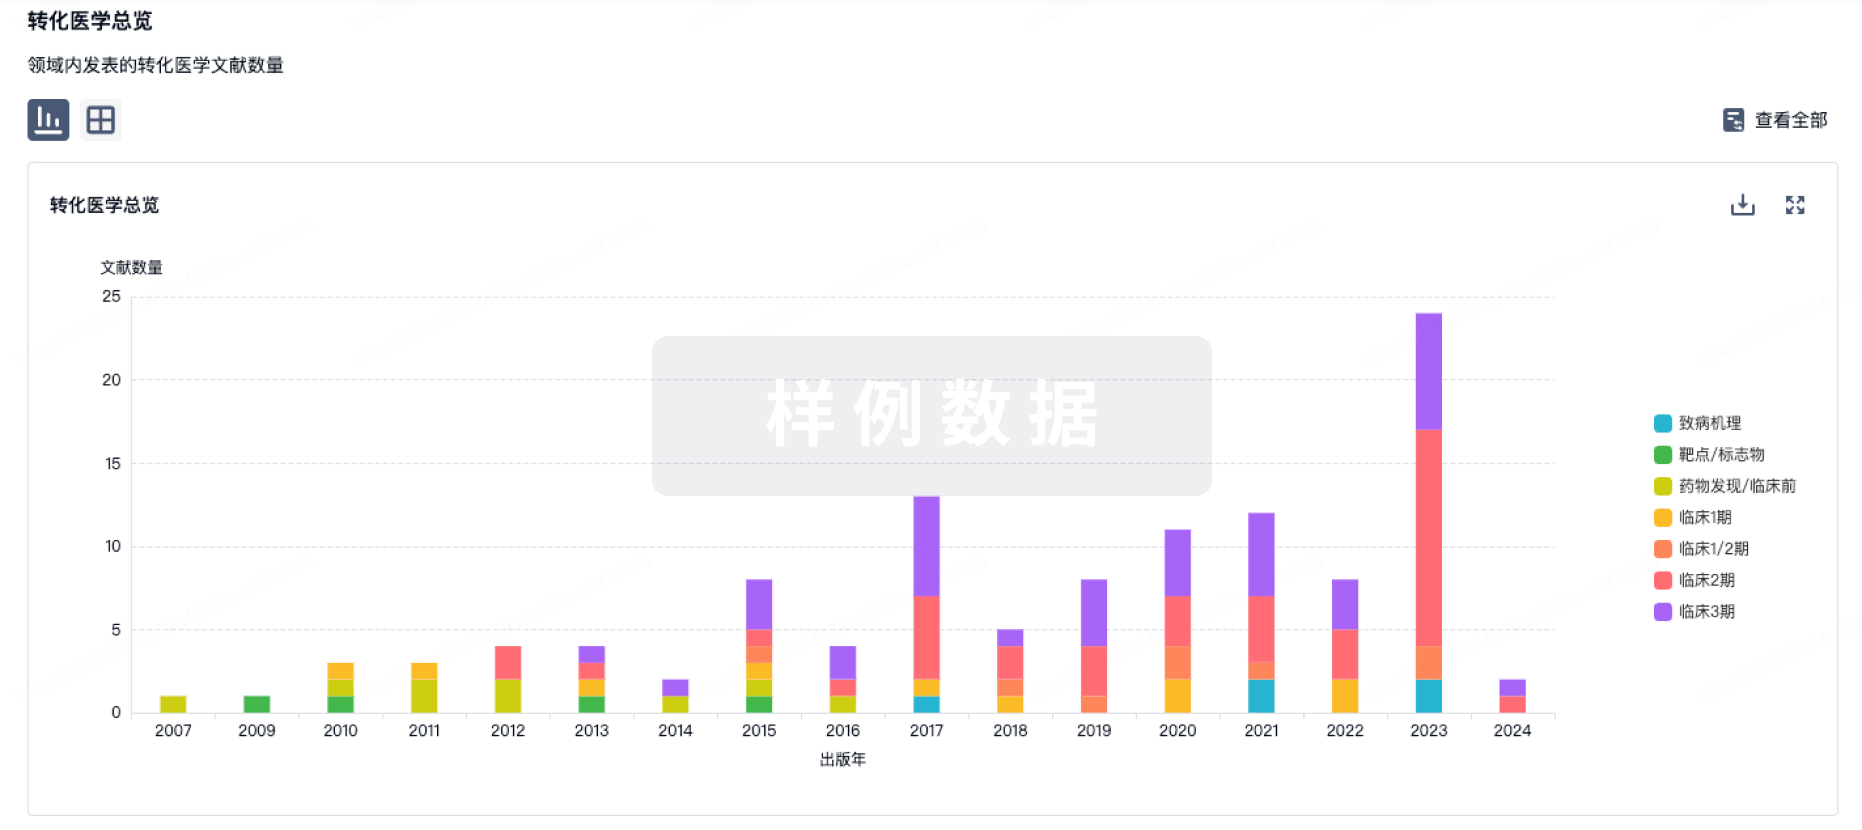
转化医学
使用我们的转化医学数据加速您的研究。
登录
或
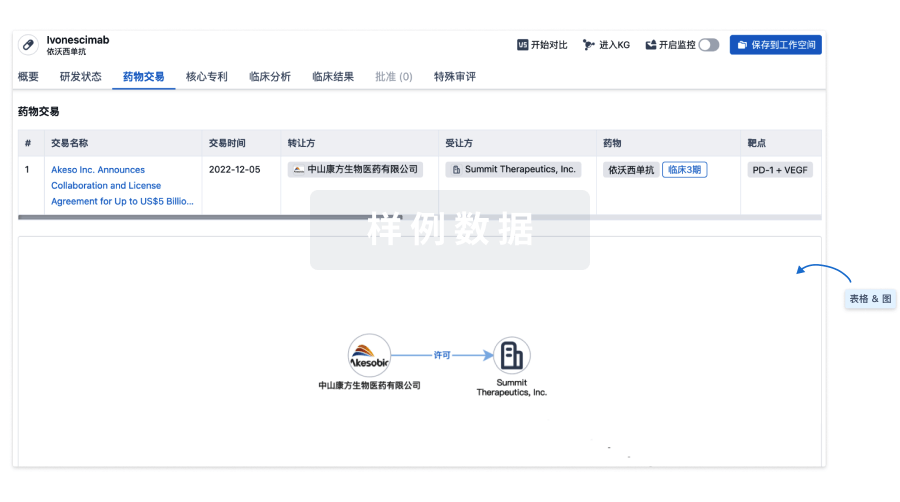
药物交易
使用我们的药物交易数据加速您的研究。
登录
或
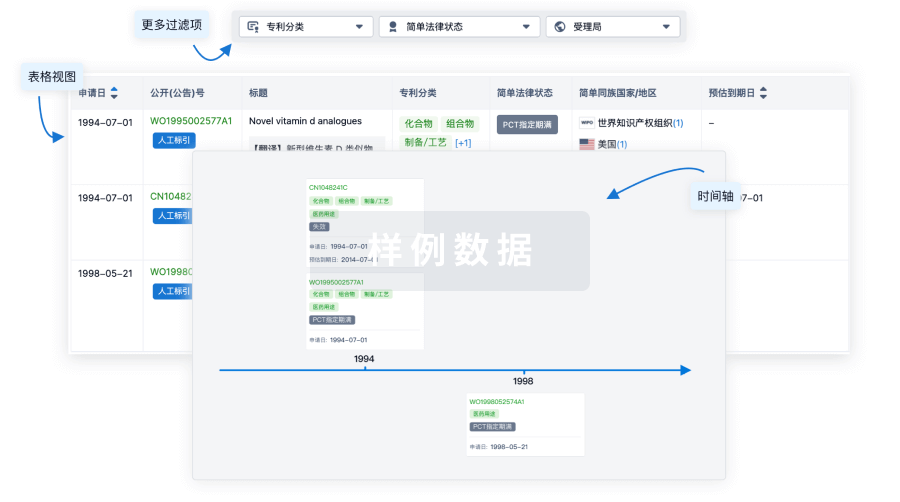
核心专利
使用我们的核心专利数据促进您的研究。
登录
或
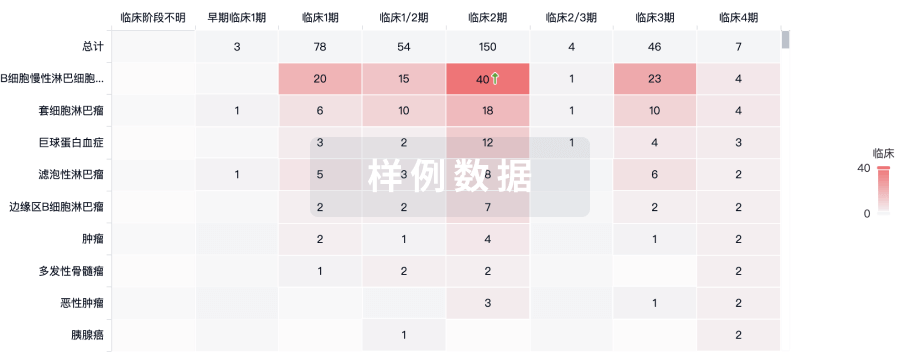
临床分析
紧跟全球注册中心的最新临床试验。
登录
或
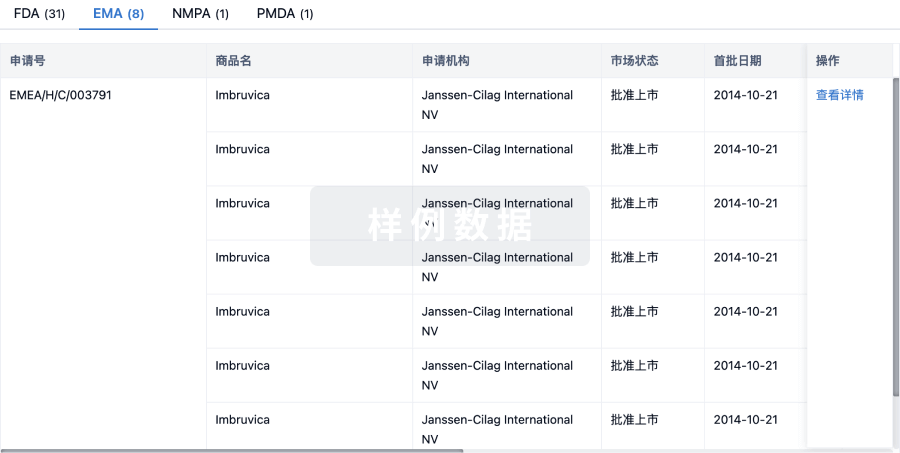
批准
利用最新的监管批准信息加速您的研究。
登录
或
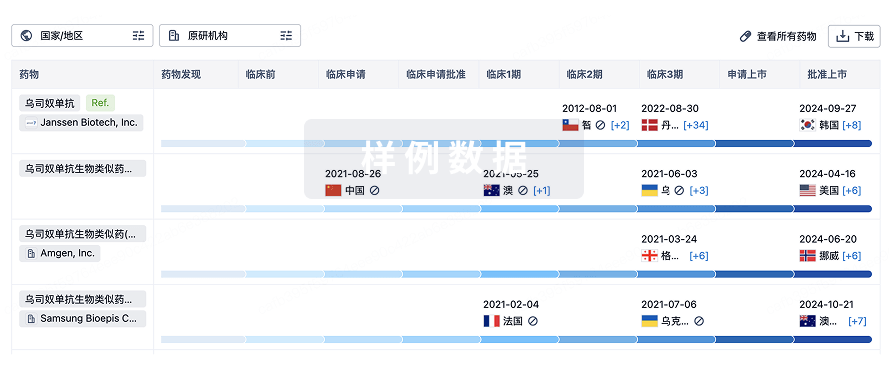
生物类似药
生物类似药在不同国家/地区的竞争态势。请注意临床1/2期并入临床2期,临床2/3期并入临床3期
登录
或
特殊审评
只需点击几下即可了解关键药物信息。
登录
或
生物医药百科问答
全新生物医药AI Agent 覆盖科研全链路,让突破性发现快人一步
立即开始免费试用!
智慧芽新药情报库是智慧芽专为生命科学人士构建的基于AI的创新药情报平台,助您全方位提升您的研发与决策效率。
立即开始数据试用!
智慧芽新药库数据也通过智慧芽数据服务平台,以API或者数据包形式对外开放,助您更加充分利用智慧芽新药情报信息。
生物序列数据库
生物药研发创新
免费使用
化学结构数据库
小分子化药研发创新
免费使用