预约演示
更新于:2025-09-09
Taro Pharmaceuticals, Inc.
更新于:2025-09-09
概览
标签
皮肤和肌肉骨骼疾病
免疫系统疾病
感染
小分子化药
疾病领域得分
一眼洞穿机构专注的疾病领域

技术平台
公司药物应用最多的技术
靶点
公司最常开发的靶点
关联
靶点 |
作用机制 |
在研机构 |
原研机构 |
在研适应症 |
非在研适应症 |
最高研发阶段 |
首次获批国家/地区 |
首次获批日期 |

靶点 |
作用机制 |
在研机构 |
原研机构 |
在研适应症 |
非在研适应症 |
最高研发阶段 |
首次获批国家/地区 |
首次获批日期 |
NCT01757873
A Phase 2, Multicenter, Randomized, Double-Blind, Placebo-Controlled, Parallel-Group Study to Evaluate the Efficacy and Safety of Z160 in Subjects With Postherpetic Neuralgia

NCT01655849
A Phase 2, Multicenter, Randomized, Double-Blind, Placebo-Controlled, Parallel-Group Study to Evaluate The Efficacy and Safety of Z160 in Subjects With Neuropathic Pain From Lumbosacral Radiculopathy
NCT01252199
A Phase II Study of Chimeric Monoclonal Antibodies to Shiga Toxins 1 (cαStx1) and 2 (cαStx2) Administered Concomitantly to Children With Shiga Toxin-Producing Bacterial (STPB) Infection and Bloody Diarrhea (SHIGATEC Trial)

100 项与 Taro Pharmaceuticals, Inc. 相关的临床结果
登录后查看更多信息
登录后查看更多信息
2025-03-01Recent advances in drug delivery and formulation
QbD-driven Formulation Development and Evaluation of Genistein Nanoparticles for Prostate Cancer
Article
作者: Patel, Priya ; Patel, Nirav
Background::
Genistein (GEN) shows significant anticancer potential, particularly
against prostate cancer. However, its clinical application is limited by poor water solubility, rapid
metabolism and excretion, low bioavailability, and lack of targeted delivery to cancer cells, hindering
its effectiveness as a chemopreventive or therapeutic agent.
Objective::
In this study, poly-ε-caprolactone (PCL) nanoparticles incorporating polyvinyl alcohol
(PVA) as a stabilizer were engineered to encapsulate genistein (GEN) effectively. Utilizing a Quality
by Design (QbD) methodology, the development and optimization of these nanoparticles were
systematically approached.
Methods::
GEN-loaded PCL nanoparticles (NPs) were prepared using the Solvent Evaporation
Technique, ideal for encapsulating hydrophobic drugs. A Plackett–Burman design (PBD) identified
key factors, followed by a Box–Behnken design (BBD) to optimize nanoparticle quality. The NPs
were evaluated for particle size, zeta potential (ZP), polydispersity index (PDI), morphology, encapsulation
efficiency (EE), in vitro drug release, and cytotoxicity.
Results::
The optimized formulation containing PCL, PVA, and Volume of organic solvent as 43.7
mg, 6.2 mg, and 10.0 ml, respectively was chosen because it showed EE (%) of 94.0%, average particle
size of 150 nm, PDI of 0.10, ZP of -28.0 and exhibited sustained release of GEN for around
four days. The antiproliferative activities of GEN PCL NPs were confirmed by the MTT test in
vitro on malignant prostate carcinoma cell lines (PC3). Flow cytometric analysis showed that the
inhibition of cell proliferation of more potent GEN PCL NPs is comparable with the effects of free
GEN.
Conclusion::
The findings indicate that genistein-loaded PCL nanoparticles have the potential to
augment the anticancer efficacy of genistein, both in vitro and in vivo. This suggests their promise
as a viable candidate for prostate cancer treatment.
2015-04-01Clinical and vaccine immunology : CVI
Protective Efficacy and Pharmacokinetics of Human/Mouse Chimeric Anti-Stx1 and Anti-Stx2 Antibodies in Mice
Article
作者: Carvalho, H M ; O'Brien, A D ; Melton-Celsa, Angela R ; Thuning-Roberson, Claire
ABSTRACT:
In the United States, Shiga toxin (Stx)-producingEscherichia coli(STEC) is the most frequent infectious cause of hemorrhagic colitis. Hemolytic uremic syndrome (HUS) is a serious sequela that may develop after STEC infection that can lead to renal failure and death in up to 10% of cases. STEC can produce one or more types of Stx, Stx1 and/or Stx2, and Stx1 and Stx2 are responsible for HUS-mediated kidney damage. We previously generated two monoclonal antibodies (MAbs) that neutralize the toxicity of Stx1 or Stx2. In this study, we evaluated the protective efficacy of human/mouse chimeric versions of those monoclonal antibodies, named cαStx1 and cαStx2. Mice given an otherwise lethal dose of Stx1 were protected from death when injected with cαStx1 either 1 h before or 1 h after toxin injection. Additionally, streptomycin-treated mice fed the mouse-lethal STEC strain B2F1 that produces the Stx2 variant Stx2d were protected when given a dose of 0.1 mg of cαStx2/kg of body weight administered up to 72 h post-oral bacterial challenge. Since many STEC strains produce both Stx1 and Stx2 and since either toxin may lead to the HUS, we also assessed the protective efficacy of the combined MAbs. We found that both antibodies were required to protect mice from the presence of both Stx1 and Stx2. Pharmacokinetic studies indicated that cαStx1 and cαStx2 had serum half-lives (t1/2) of about 50 and 145 h, respectively. We propose that cαStx1 and cαStx2, both of which have been tested for safety in humans, could be used therapeutically for prevention or treatment early in the development of HUS.
2012-04-01Journal of neuro-oncology2区 · 医学
A phase II study of the Ras-MAPK signaling pathway inhibitor TLN-4601 in patients with glioblastoma at first progression
2区 · 医学
Article
作者: David Mathieu ; Karl Belanger ; Warren P. Mason ; Garth Nicholas ; Didier Reymond ; Annick Desjardins ; Isabelle Vallières ; Petr Kavan ; Antonio Omuro
This phase II trial was undertaken to evaluate the efficacy of TLN-4601 in patients with glioblastoma (GBM) at first progression. TLN-4601 inhibits the Ras-MAPK signaling pathway, and in animal models crosses the blood-brain barrier and accumulates in implanted gliomas, possibly by binding specifically to the peripheral benzodiazepine receptor. A maximum of 40 patients with recurrent GBM were to be enrolled in this study. TLN-4601 was administered at a dose of 480 mg/m(2)/day by continuous intravenous (CIV) administration. Each 21-day cycle consisted of a 14-day CIV administration and a 7-day recovery period. Samples were obtained from all patients for pharmacokinetic evaluations (PK) and for Raf-1 and pERK biomarker assessment using immunohistochemistry and flow cytometry. Following enrollment of 20 patients, this study was terminated due to a lack of efficacy. Of 17 evaluable patients, 14 had MR scans performed after two cycles of TLN-4601. Of these 14 patients, three had stable disease and 11 had disease progression. Only three patients had MR scans performed after four cycles and all had evidence of radiographic progression. Serum PKs confirmed that patients were exposed to TLN-4601 at targeted drug levels. TLN-4601 was generally well tolerated although two patients discontinued treatment due to adverse events. Biomarker analysis did not show consistent changes. TLN-4601 infused via CIV at 480 mg/m(2)/day for 14 of 21 days is well tolerated by patients with progressive GBM. However, this agent is ineffective in progressive GBM when administered as monotherapy in this schedule.


100 项与 Taro Pharmaceuticals, Inc. 相关的药物交易
登录后查看更多信息
100 项与 Taro Pharmaceuticals, Inc. 相关的转化医学
登录后查看更多信息
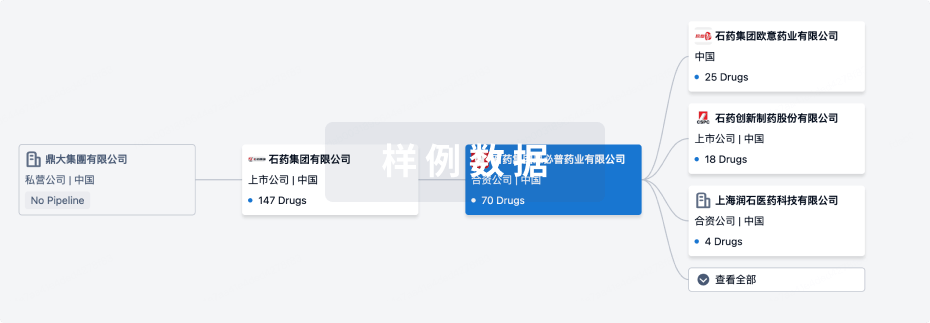
组织架构
使用我们的机构树数据加速您的研究。
登录
或
管线布局
2025年11月03日管线快照
管线布局中药物为当前组织机构及其子机构作为药物机构进行统计,早期临床1期并入临床1期,临床1/2期并入临床2期,临床2/3期并入临床3期
批准上市
2
12
其他
登录后查看更多信息
当前项目
登录后查看更多信息
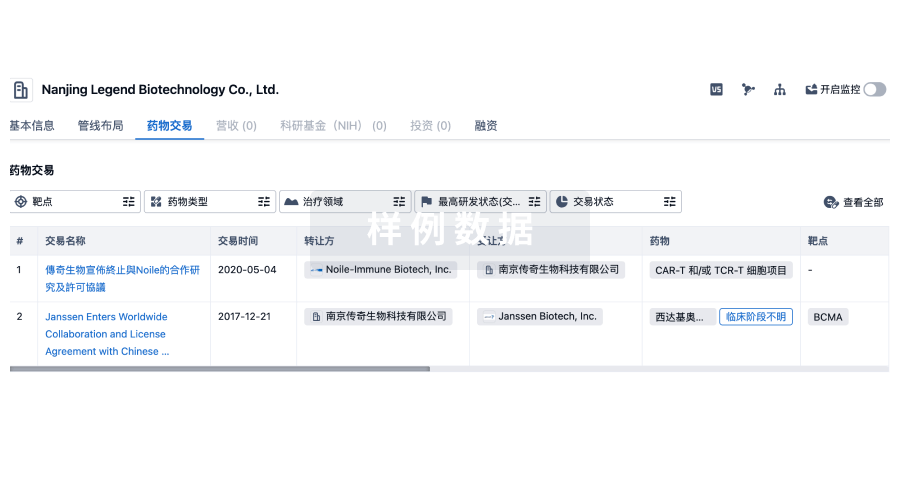
药物交易
使用我们的药物交易数据加速您的研究。
登录
或
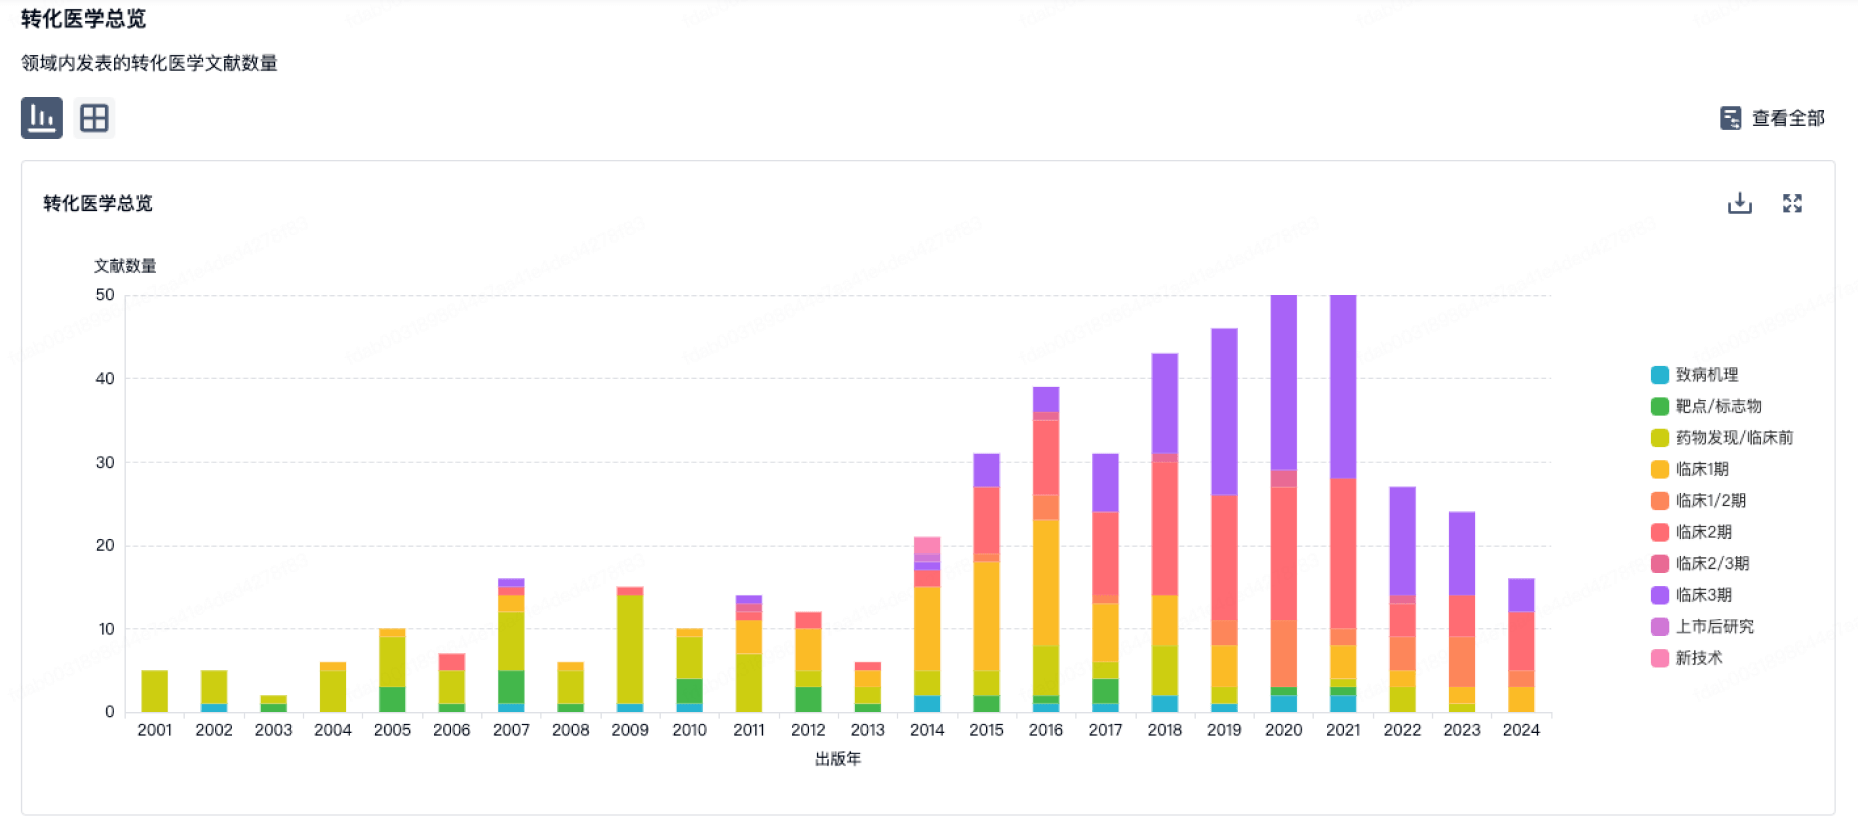
转化医学
使用我们的转化医学数据加速您的研究。
登录
或
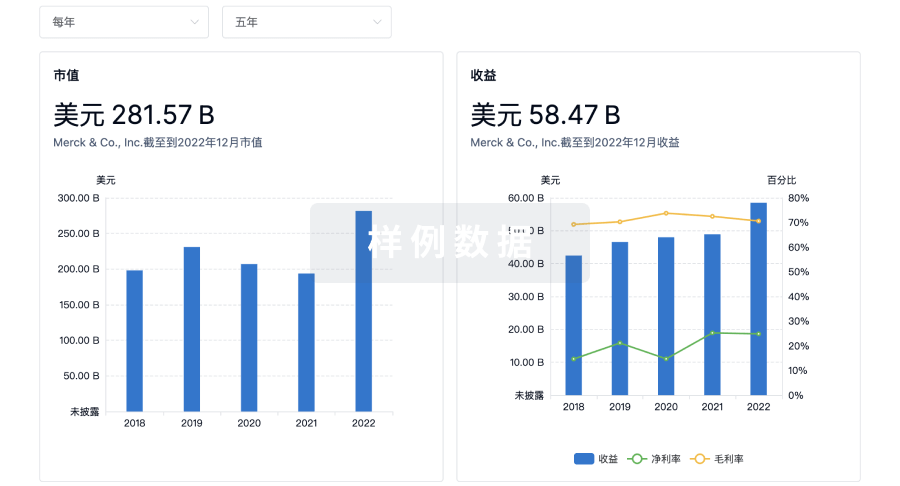
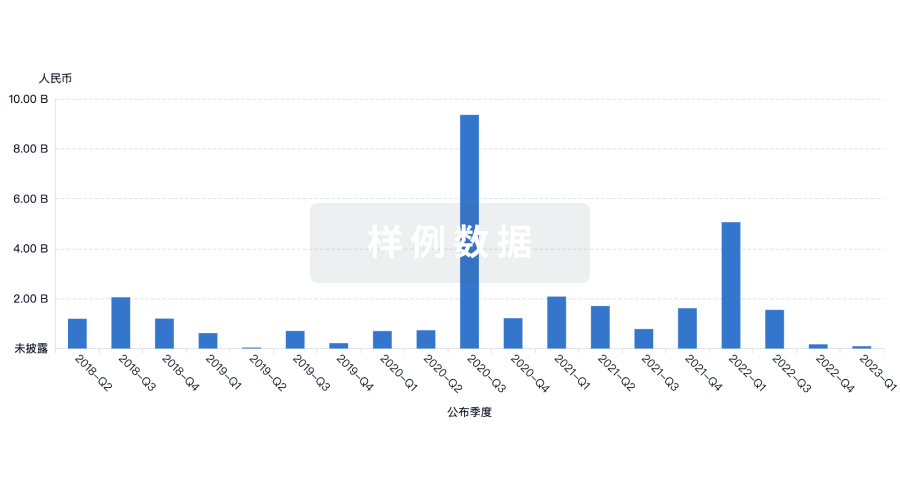
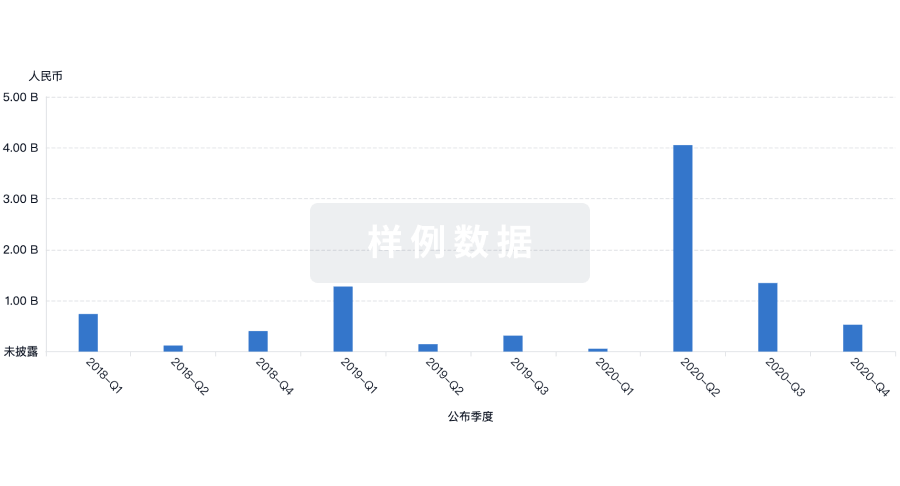
营收
使用 Synapse 探索超过 36 万个组织的财务状况。
登录
或
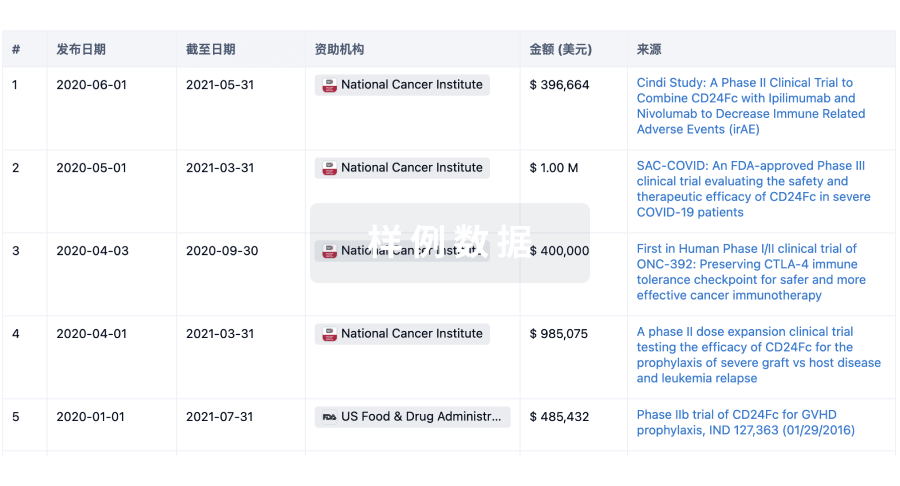
科研基金(NIH)
访问超过 200 万项资助和基金信息,以提升您的研究之旅。
登录
或
投资
深入了解从初创企业到成熟企业的最新公司投资动态。
登录
或
融资
发掘融资趋势以验证和推进您的投资机会。
登录
或
生物医药百科问答
全新生物医药AI Agent 覆盖科研全链路,让突破性发现快人一步
立即开始免费试用!
智慧芽新药情报库是智慧芽专为生命科学人士构建的基于AI的创新药情报平台,助您全方位提升您的研发与决策效率。
立即开始数据试用!
智慧芽新药库数据也通过智慧芽数据服务平台,以API或者数据包形式对外开放,助您更加充分利用智慧芽新药情报信息。
生物序列数据库
生物药研发创新
免费使用
化学结构数据库
小分子化药研发创新
免费使用