Medical Polyoxymethylene (POM) Market to grow by USD 2,719.15 million from 2022 to 2027; Rising demand from drug contact and delivery applications boosts the market - Technavio
2023-08-11
NEW YORK, Aug. 10, 2023 /PRNewswire/ -- The
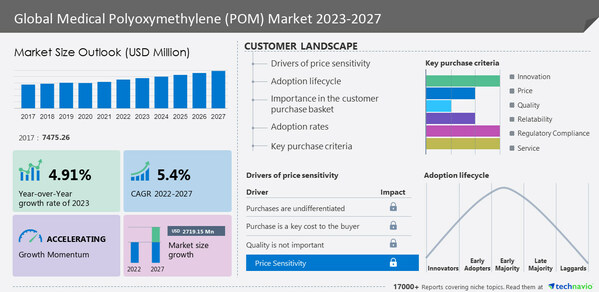
medical polyoxymethylene (POM) market is set to grow by
USD 2,719.15 million from 2022 to 2027. However, the growth momentum will progress at a
CAGR of 5.4% during the forecast period, according to Technavio. The medical polyoxymethylene (pom) market is fragmented, and the companies are seeking strong partnerships with automotive, industrial, and commercial companies to compete in the market. ADDTEK Chemical, Asahi Kasei Corp., Ascend Performance Materials Operations LLC, Avient Corp., BASF SE, Celanese Corp., Daicel Corp., DuPont de Nemours Inc., Ensinger GmbH, Inventro Polymers, Kolon Plastics Inc., LG Chem Ltd., Mitsubishi Chemical Corp., Saudi Basic Industries Corp., Westlake Plastics, Yuntianhua Group Co. Ltd., and Korea Engineering Plastics Co. Ltd. are some of the major market participants -.
To know about the company's offerings -
Request a sample report
Continue Reading
Preview
来源: PRNewswire
Technavio has announced its latest market research report titled Global Medical Polyoxymethylene (POM) Market
Medical Polyoxymethylene (POM) Market 2023-2027: Scope
Technavio presents a detailed picture of the market by way of study, synthesis, and summation of data from multiple sources. The medical polyoxymethylene (pom) market report covers the following areas:
Medical Polyoxymethylene (POM) Market Size
Medical Polyoxymethylene (POM) Market Trends
Medical Polyoxymethylene (POM) Market Industry Analysis
Porter's Five Forces Analysis
Customer Landscape
The medical polyoxymethylene (POM) market is fragmented, and the degree of fragmentation will accelerate. The rising demand from drug contact and delivery applications will offer immense growth opportunities. However, the stringent regulations on polyoxymethylene will hamper the market growth.
Medical Polyoxymethylene (POM) Market 2023-2027: Drivers & Challenges
DRIVERS
The increasing demand from drug contact and delivery applications drives the medical polyoxymethylene (POM) market growth. One of the main applications of polyoxyethylene is in the manufacturing of medical devices that require constant cleaning and sterilization. There is increasing adoption of polyoxyethylene due to its several properties such as high strength and stiffness and low-frictional properties. Additionally, it is extensively used in the manufacture of implantable medical devices, which needs materials that are biocompatible. Furthermore, there is an increasing preference for polyoxyethylene for orthopedic implants and dental implants due to its biocompatible and lightweight properties. Hence, such factors are expected to drive market growth during the forecast period.
TRENDS
The emerging applications in tissue engineering are a primary trend in the market during the forecast period. One of the main applications of polyoxyethylene includes engineering thermoplastics mainly due to its mechanical properties, high stiffness, low friction coefficient, and dimensional stability. The main emerging trend in the market is the use of polyoxymethylene in tissue engineering. There is increasing demand for scaffold materials over the past decade as they offer a platform for tissue repair and regeneration. Some of the main advantages of polyoxymethylene-based scaffold materials are its high level of biocompatibility as well as high mechanical strength that can withstand the mechanical stresses and strains that arise during surgical implantation and in-vivo tissue growth. Hence, such factors are expected to drive market growth during the forecast period.
CHALLENGES
Stringent regulations on polyoxyethylene are a major challenge hindering the medical polyoxymethylene market growth. There is an increase in the adoption of polyoxyethylene across the hospital sector due to its various applications. Some of the key medical devices which are manufactured using polyoxyethylene include valves, cannulas, connectors, and other small devices. However, there are severe side effects and reactions in patients due to the presence of polyoxyethylene. Some of the key allergic reactions which are caused due to polyoxyethylene include mild skin irritation or severe anaphylaxis. Hence, such factors can negatively impact market growth which in turn can hinder the medical polyoxymethylene market growth during the forecast period.
To learn more about the global trends impacting the future of market research, download a PDF sample
Medical Polyoxymethylene (POM) Market 2023-2027: Segment Analysis
Type
Homopolymer POM
Copolymer POM
Application
Dialysis Machine
Handles For Surgical Instruments
Inhalers
Others
Geography
APAC
North America
Europe
South America
Middle East And Africa
Medical Polyoxymethylene (POM) Market 2023-2027: Segmentation Highlights
The market share growth by the
homopolymer POM segment will be significant during the forecast period. There is increasing adoption of the homopolymer POM segment across healthcare sectors due to its several properties such as high strength, rigidity, and chemical resistance. Additionally, there is a growing popularity for homopolymer POM for several medical applications, including stethoscopes and spare parts, sphygmomanometers and spares, otoscopes, ophthalmoscopes, pulse oximeters, fetal doppler, and others. Hence, such factors are expected to fuel the growth of this segment which in turn will drive the market growth during the forecast period.
The competitive scenario categorizes companies based on various performance indicators. Some of the factors considered include the financial performance of companies, growth strategies, product innovations, new product launches, investments, and growth in market share, among others
Buy the Report
Medical Polyoxymethylene (POM) Market 2023-2027: Key Highlights
CAGR of the market during the forecast period 2023-2027
Detailed information on factors that will assist Medical Polyoxymethylene (POM) Market growth during the next five years
Estimation of the Medical Polyoxymethylene (POM) Market size and its contribution to the parent market
Predictions on upcoming trends and changes in consumer behavior
The growth of the Medical Polyoxymethylene (POM) Market across APAC, North America, Europe, South America, and the Middle East and Africa
Analysis of the market's competitive landscape and detailed information on vendors
Comprehensive details of factors that will challenge the growth of Medical Polyoxymethylene (POM) Market players
Get Instant access to 17000+ market research report
Technavio's Subscription Platform
Related Reports:
The
squalene market is estimated to grow by USD 64.75 million between 2022 and 2027 exhibiting a CAGR of 7.36%. Squalene is a natural 30-carbon triterpene. It is an oily liquid hydrocarbon found in plants and animals. Squalene is largely found in shark liver oil as it contributes approximately one-third of the body weight of the fish. In recent years, squalene has also been derived from renewable plant sources such as rice bran oil, olive oil, wheat germ, and amaranth oil.
The
hot melt adhesives market size is estimated to grow at a CAGR of 7.28% between 2022 and 2027. The market size is forecast to increase by USD 4,396.66 million. This hot melt adhesives market report extensively covers market segmentation by product (ethylene-vinyl acetate (EVA), rubber, polyolefin, polyurethane, and others), application (packaging, nonwoven hygiene products, furniture, and woodworking, automobile, and footwear, and others), and geography (APAC, North America, Europe, South America, and the Middle East and Africa). High application in sanitary materials is one of the key factors driving the growth of the global hot melt adhesives market.
Table of Contents
1 Executive Summary
1.1 Market overview
Exhibit 01: Executive Summary – Chart on Market Overview
Exhibit 02: Executive Summary – Data Table on Market Overview
Exhibit 03: Executive Summary – Chart on Global Market Characteristics
Exhibit 04: Executive Summary – Chart on Market by Geography
Exhibit 05: Executive Summary – Chart on Market Segmentation by Type
Exhibit 06: Executive Summary – Chart on Market Segmentation by Application
Exhibit 07: Executive Summary – Chart on Incremental Growth
Exhibit 08: Executive Summary – Data Table on Incremental Growth
Exhibit 09: Executive Summary – Chart on Vendor Market Positioning
2 Market Landscape
2.1 Market ecosystem
Exhibit 10: Parent market
Exhibit 11: Market Characteristics
3 Market Sizing
3.1 Market definition
Exhibit 12: Offerings of vendors included in the market definition
3.2 Market segment analysis
Exhibit 13: Market segments
3.3 Market size 2022
3.4 Market outlook: Forecast for 2022-2027
Exhibit 14: Chart on Global - Market size and forecast 2022-2027 ($ million)
Exhibit 15: Data Table on Global - Market size and forecast 2022-2027 ($ million)
Exhibit 16: Chart on Global Market: Year-over-year growth 2022-2027 (%)
Exhibit 17: Data Table on Global Market: Year-over-year growth 2022-2027 (%)
4 Historic Market Size
4.1 Global medical polyoxymethylene (POM) market 2017 - 2021
Exhibit 18: Historic Market Size – Data Table on global medical polyoxymethylene (pom) market 2017 - 2021 ($ million)
4.2 Type Segment Analysis 2017 - 2021
Exhibit 19: Historic Market Size – Type Segment 2017 - 2021 ($ million)
4.3 Application Segment Analysis 2017 - 2021
Exhibit 20: Historic Market Size – Application Segment 2017 - 2021 ($ million)
4.4 Geography Segment Analysis 2017 - 2021
Exhibit 21: Historic Market Size – Geography Segment 2017 - 2021 ($ million)
4.5 Country Segment Analysis 2017 - 2021
Exhibit 22: Historic Market Size – Country Segment 2017 - 2021 ($ million)
5 Five Forces Analysis
5.1 Five forces summary
Exhibit 23: Five forces analysis - Comparison between 2022 and 2027
5.2 Bargaining power of buyers
Exhibit 24: Chart on Bargaining power of buyers – Impact of key factors 2022 and 2027
5.3 Bargaining power of suppliers
Exhibit 25: Bargaining power of suppliers – Impact of key factors in 2022 and 2027
5.4 Threat of new entrants
Exhibit 26: Threat of new entrants – Impact of key factors in 2022 and 2027
5.5 Threat of substitutes
Exhibit 27: Threat of substitutes – Impact of key factors in 2022 and 2027
5.6 Threat of rivalry
Exhibit 28: Threat of rivalry – Impact of key factors in 2022 and 2027
5.7 Market condition
Exhibit 29: Chart on Market condition - Five forces 2022 and 2027
6 Market Segmentation by Type
6.1 Market segments
Exhibit 30: Chart on Type - Market share 2022-2027 (%)
Exhibit 31: Data Table on Type - Market share 2022-2027 (%)
6.2 Comparison by Type
Exhibit 32: Chart on Comparison by Type
Exhibit 33: Data Table on Comparison by Type
6.3 Homopolymer POM - Market size and forecast 2022-2027
Exhibit 34: Chart on Homopolymer POM - Market size and forecast 2022-2027 ($ million)
Exhibit 35: Data Table on Homopolymer POM - Market size and forecast 2022-2027 ($ million)
Exhibit 36: Chart on Homopolymer POM - Year-over-year growth 2022-2027 (%)
Exhibit 37: Data Table on Homopolymer POM - Year-over-year growth 2022-2027 (%)
6.4 Copolymer POM - Market size and forecast 2022-2027
Exhibit 38: Chart on Copolymer POM - Market size and forecast 2022-2027 ($ million)
Exhibit 39: Data Table on Copolymer POM - Market size and forecast 2022-2027 ($ million)
Exhibit 40: Chart on Copolymer POM - Year-over-year growth 2022-2027 (%)
Exhibit 41: Data Table on Copolymer POM - Year-over-year growth 2022-2027 (%)
6.5 Market opportunity by Type
Exhibit 42: Market opportunity by Type ($ million)
Exhibit 43: Data Table on Market opportunity by Type ($ million)
7 Market Segmentation by Application
7.1 Market segments
Exhibit 44: Chart on Application - Market share 2022-2027 (%)
Exhibit 45: Data Table on Application - Market share 2022-2027 (%)
7.2 Comparison by Application
Exhibit 46: Chart on Comparison by Application
Exhibit 47: Data Table on Comparison by Application
7.3 Dialysis machine - Market size and forecast 2022-2027
Exhibit 48: Chart on Dialysis machine - Market size and forecast 2022-2027 ($ million)
Exhibit 49: Data Table on Dialysis machine - Market size and forecast 2022-2027 ($ million)
Exhibit 50: Chart on Dialysis machine - Year-over-year growth 2022-2027 (%)
Exhibit 51: Data Table on Dialysis machine - Year-over-year growth 2022-2027 (%)
7.4 Handles for surgical instruments - Market size and forecast 2022-2027
Exhibit 52: Chart on Handles for surgical instruments - Market size and forecast 2022-2027 ($ million)
Exhibit 53: Data Table on Handles for surgical instruments - Market size and forecast 2022-2027 ($ million)
Exhibit 54: Chart on Handles for surgical instruments - Year-over-year growth 2022-2027 (%)
Exhibit 55: Data Table on Handles for surgical instruments - Year-over-year growth 2022-2027 (%)
7.5 Inhalers - Market size and forecast 2022-2027
Exhibit 56: Chart on Inhalers - Market size and forecast 2022-2027 ($ million)
Exhibit 57: Data Table on Inhalers - Market size and forecast 2022-2027 ($ million)
Exhibit 58: Chart on Inhalers - Year-over-year growth 2022-2027 (%)
Exhibit 59: Data Table on Inhalers - Year-over-year growth 2022-2027 (%)
7.6 Others - Market size and forecast 2022-2027
Exhibit 60: Chart on Others - Market size and forecast 2022-2027 ($ million)
Exhibit 61: Data Table on Others - Market size and forecast 2022-2027 ($ million)
Exhibit 62: Chart on Others - Year-over-year growth 2022-2027 (%)
Exhibit 63: Data Table on Others - Year-over-year growth 2022-2027 (%)
7.7 Market opportunity by Application
Exhibit 64: Market opportunity by Application ($ million)
Exhibit 65: Data Table on Market opportunity by Application ($ million)
8 Customer Landscape
8.1 Customer landscape overview
Exhibit 66: Analysis of price sensitivity, lifecycle, customer purchase basket, adoption rates, and purchase criteria
9 Geographic Landscape
9.1 Geographic segmentation
Exhibit 67: Chart on Market share by geography 2022-2027 (%)
Exhibit 68: Data Table on Market share by geography 2022-2027 (%)
9.2 Geographic comparison
Exhibit 69: Chart on Geographic comparison
Exhibit 70: Data Table on Geographic comparison
9.3 APAC - Market size and forecast 2022-2027
Exhibit 71: Chart on APAC - Market size and forecast 2022-2027 ($ million)
Exhibit 72: Data Table on APAC - Market size and forecast 2022-2027 ($ million)
Exhibit 73: Chart on APAC - Year-over-year growth 2022-2027 (%)
Exhibit 74: Data Table on APAC - Year-over-year growth 2022-2027 (%)
9.4 North America - Market size and forecast 2022-2027
Exhibit 75: Chart on North America - Market size and forecast 2022-2027 ($ million)
Exhibit 76: Data Table on North America - Market size and forecast 2022-2027 ($ million)
Exhibit 77: Chart on North America - Year-over-year growth 2022-2027 (%)
Exhibit 78: Data Table on North America - Year-over-year growth 2022-2027 (%)
9.5 Europe - Market size and forecast 2022-2027
Exhibit 79: Chart on Europe - Market size and forecast 2022-2027 ($ million)
Exhibit 80: Data Table on Europe - Market size and forecast 2022-2027 ($ million)
Exhibit 81: Chart on Europe - Year-over-year growth 2022-2027 (%)
Exhibit 82: Data Table on Europe - Year-over-year growth 2022-2027 (%)
9.6 South America - Market size and forecast 2022-2027
Exhibit 83: Chart on South America - Market size and forecast 2022-2027 ($ million)
Exhibit 84: Data Table on South America - Market size and forecast 2022-2027 ($ million)
Exhibit 85: Chart on South America - Year-over-year growth 2022-2027 (%)
Exhibit 86: Data Table on South America - Year-over-year growth 2022-2027 (%)
9.7 Middle East and Africa - Market size and forecast 2022-2027
Exhibit 87: Chart on Middle East and Africa - Market size and forecast 2022-2027 ($ million)
Exhibit 88: Data Table on Middle East and Africa - Market size and forecast 2022-2027 ($ million)
Exhibit 89: Chart on Middle East and Africa - Year-over-year growth 2022-2027 (%)
Exhibit 90: Data Table on Middle East and Africa - Year-over-year growth 2022-2027 (%)
9.8 US - Market size and forecast 2022-2027
Exhibit 91: Chart on US - Market size and forecast 2022-2027 ($ million)
Exhibit 92: Data Table on US - Market size and forecast 2022-2027 ($ million)
Exhibit 93: Chart on US - Year-over-year growth 2022-2027 (%)
Exhibit 94: Data Table on US - Year-over-year growth 2022-2027 (%)
9.9 China - Market size and forecast 2022-2027
Exhibit 95: Chart on China - Market size and forecast 2022-2027 ($ million)
Exhibit 96: Data Table on China - Market size and forecast 2022-2027 ($ million)
Exhibit 97: Chart on China - Year-over-year growth 2022-2027 (%)
Exhibit 98: Data Table on China - Year-over-year growth 2022-2027 (%)
9.10 Germany - Market size and forecast 2022-2027
Exhibit 99: Chart on Germany - Market size and forecast 2022-2027 ($ million)
Exhibit 100: Data Table on Germany - Market size and forecast 2022-2027 ($ million)
Exhibit 101: Chart on Germany - Year-over-year growth 2022-2027 (%)
Exhibit 102: Data Table on Germany - Year-over-year growth 2022-2027 (%)
9.11 India - Market size and forecast 2022-2027
Exhibit 103: Chart on India - Market size and forecast 2022-2027 ($ million)
Exhibit 104: Data Table on India - Market size and forecast 2022-2027 ($ million)
Exhibit 105: Chart on India - Year-over-year growth 2022-2027 (%)
Exhibit 106: Data Table on India - Year-over-year growth 2022-2027 (%)
9.12 UK - Market size and forecast 2022-2027
Exhibit 107: Chart on UK - Market size and forecast 2022-2027 ($ million)
Exhibit 108: Data Table on UK - Market size and forecast 2022-2027 ($ million)
Exhibit 109: Chart on UK - Year-over-year growth 2022-2027 (%)
Exhibit 110: Data Table on UK - Year-over-year growth 2022-2027 (%)
9.13 Market opportunity by geography
Exhibit 111: Market opportunity by geography ($ million)
Exhibit 112: Data Tables on Market opportunity by geography ($ million)
10 Drivers, Challenges, and Trends
10.1 Market drivers
10.2 Market challenges
10.3 Impact of drivers and challenges
Exhibit 113: Impact of drivers and challenges in 2022 and 2027
10.4 Market trends
11 Vendor Landscape
11.1 Overview
11.2 Vendor landscape
Exhibit 114: Overview on Criticality of inputs and Factors of differentiation
11.3 Landscape disruption
Exhibit 115: Overview on factors of disruption
11.4 Industry risks
Exhibit 116: Impact of key risks on business
12 Vendor Analysis
12.1 Vendors covered
Exhibit 117: Vendors covered
12.2 Market positioning of vendors
Exhibit 118: Matrix on vendor position and classification
12.3 Asahi Kasei Corp.
Exhibit 119: Asahi Kasei Corp. - Overview
Exhibit 120: Asahi Kasei Corp. - Business segments
Exhibit 121: Asahi Kasei Corp. - Key news
Exhibit 122: Asahi Kasei Corp. - Key offerings
Exhibit 123: Asahi Kasei Corp. - Segment focus
12.4 Avient Corp.
Exhibit 124: Avient Corp. - Overview
Exhibit 125: Avient Corp. - Business segments
Exhibit 126: Avient Corp. - Key offerings
Exhibit 127: Avient Corp. - Segment focus
12.5 BASF SE
Exhibit 128: BASF SE - Overview
Exhibit 129: BASF SE - Business segments
Exhibit 130: BASF SE - Key news
Exhibit 131: BASF SE - Key offerings
Exhibit 132: BASF SE - Segment focus
12.6 Celanese Corp.
Exhibit 133: Celanese Corp. - Overview
Exhibit 134: Celanese Corp. - Business segments
Exhibit 135: Celanese Corp. - Key offerings
Exhibit 136: Celanese Corp. - Segment focus
12.7 Daicel Corp.
Exhibit 137: Daicel Corp. - Overview
Exhibit 138: Daicel Corp. - Business segments
Exhibit 139: Daicel Corp. - Key offerings
Exhibit 140: Daicel Corp. - Segment focus
Exhibit 141: DuPont de Nemours Inc. - Overview
Exhibit 142: DuPont de Nemours Inc. - Business segments
Exhibit 143: DuPont de Nemours Inc. - Key news
Exhibit 144: DuPont de Nemours Inc. - Key offerings
Exhibit 145: DuPont de Nemours Inc. - Segment focus
12.9 Ensinger GmbH
Exhibit 146: Ensinger GmbH - Overview
Exhibit 147: Ensinger GmbH - Product / Service
Exhibit 148: Ensinger GmbH - Key offerings
12.10 Inventro Polymers
Exhibit 149: Inventro Polymers - Overview
Exhibit 150: Inventro Polymers - Product / Service
Exhibit 151: Inventro Polymers - Key offerings
12.11 Kolon Plastics Inc.
Exhibit 152: Kolon Plastics Inc. - Overview
Exhibit 153: Kolon Plastics Inc. - Product / Service
Exhibit 154: Kolon Plastics Inc. - Key offerings
12.12 Korea Engineering Plastics Co. Ltd.
Exhibit 155: Korea Engineering Plastics Co. Ltd. - Overview
Exhibit 156: Korea Engineering Plastics Co. Ltd. - Product / Service
Exhibit 157: Korea Engineering Plastics Co. Ltd. - Key offerings
12.13 LG Chem Ltd.
Exhibit 158: LG Chem Ltd. - Overview
Exhibit 159: LG Chem Ltd. - Business segments
Exhibit 160: LG Chem Ltd. - Key news
Exhibit 161: LG Chem Ltd. - Key offerings
Exhibit 162: LG Chem Ltd. - Segment focus
Exhibit 163: Mitsubishi Chemical Corp. - Overview
Exhibit 164: Mitsubishi Chemical Corp. - Business segments
Exhibit 165: Mitsubishi Chemical Corp. - Key news
Exhibit 166: Mitsubishi Chemical Corp. - Key offerings
Exhibit 167: Mitsubishi Chemical Corp. - Segment focus
12.15 Saudi Basic Industries Corp.
Exhibit 168: Saudi Basic Industries Corp. - Overview
Exhibit 169: Saudi Basic Industries Corp. - Business segments
Exhibit 170: Saudi Basic Industries Corp. - Key offerings
Exhibit 171: Saudi Basic Industries Corp. - Segment focus
12.16 Westlake Plastics
Exhibit 172: Westlake Plastics - Overview
Exhibit 173: Westlake Plastics - Product / Service
Exhibit 174: Westlake Plastics - Key offerings
12.17 Yuntianhua Group Co. Ltd.
Exhibit 175: Yuntianhua Group Co. Ltd. - Overview
Exhibit 176: Yuntianhua Group Co. Ltd. - Product / Service
Exhibit 177: Yuntianhua Group Co. Ltd. - Key offerings
13 Appendix
13.1 Scope of the report
13.2 Inclusions and exclusions checklist
Exhibit 178: Inclusions checklist
Exhibit 179: Exclusions checklist
13.3 Currency conversion rates for US$
Exhibit 180: Currency conversion rates for US$
13.4 Research methodology
Exhibit 181: Research methodology
Exhibit 182: Validation techniques employed for market sizing
Exhibit 183: Information sources
13.5 List of abbreviations
Exhibit 184: List of abbreviations
About Us
Technavio is a leading global technology research and advisory company. Their research and analysis focus on emerging market trends and provide actionable insights to help businesses identify market opportunities and develop effective strategies to optimize their market positions. With over 500 specialized analysts, Technavio's report library consists of more than 17,000 reports and counting, covering 800 technologies, spanning 50 countries. Their client base consists of enterprises of all sizes, including more than 100 Fortune 500 companies. This growing client base relies on Technavio's comprehensive coverage, extensive research, and actionable market insights to identify opportunities in existing and potential markets and assess their competitive positions within changing market scenarios.
Contact
Technavio Research
Jesse Maida
Media & Marketing Executive
US: +1 844 364 1100
UK: +44 203 893 3200
Email: [email protected]
Website: www.technavio.com
SOURCE Technavio
更多内容,请访问原始网站
文中所述内容并不反映新药情报库及其所属公司任何意见及观点,如有版权侵扰或错误之处,请及时联系我们,我们会在24小时内配合处理。
靶点
-药物
热门报告


立即开始免费试用!
智慧芽新药情报库是智慧芽专为生命科学人士构建的基于AI的创新药情报平台,助您全方位提升您的研发与决策效率。
立即开始数据试用!
智慧芽新药库数据也通过智慧芽数据服务平台,以API或者数据包形式对外开放,助您更加充分利用智慧芽新药情报信息。