预约演示
更新于:2025-05-07
Nonalcoholic fatty liver
非酒精性脂肪肝
更新于:2025-05-07
基本信息
别名 MASL、Metabolic dysfunction-associated steatotic liver、NAFL + [1] |
简介- |
关联
25
项与 非酒精性脂肪肝 相关的药物作用机制 PPARα激动剂 [+1] |
最高研发阶段批准上市 |
首次获批国家/地区 美国 |
首次获批日期2024-06-10 |
靶点 |
作用机制 FAS抑制剂 |
最高研发阶段临床3期 |
首次获批国家/地区- |
首次获批日期1800-01-20 |
靶点 |
作用机制 GHSR激动剂 |
最高研发阶段临床3期 |
首次获批国家/地区- |
首次获批日期1800-01-20 |
130
项与 非酒精性脂肪肝 相关的临床试验NCT06836609
A Phase 1, Randomized, Double-Blind, Placebo-Controlled, Two-Part Study to Evaluate the Safety, Tolerability, Pharmacokinetics, and Pharmacodynamics of a Single Dose of ALN-CIDEB in Adult Participants With Metabolic Dysfunction-Associated Steatotic Liver Disease (MASLD) and Two Doses of ALN-CIDEB in Adult Participants With Metabolic Dysfunction-Associated Steatohepatitis (MASH)
This study is researching an experimental drug called ALN-CIDEB, also referred to as "study drug". The study is focused on participants with metabolic dysfunction-associated steatotic liver disease (MASLD) (Part A) and metabolic dysfunction-associated steatohepatitis (MASH) (Part B). MASLD and MASH are long-lasting liver conditions caused by having too much fat in the liver.
The aim of the study is to see how safe and tolerable the study drug is.
The study is looking at several other research questions, including:
* What side effects may happen from taking the study drug
* How the study drug works to change liver fat content
* How much study drug and study drug metabolites (byproducts of the body breaking down the study drug) are in the blood at different times
开始日期2025-04-28 |
CTRI/2025/03/083070
Effects of Indian Foods and Ayurvedic drugs on healthy and diseased liver; Effect of Indian hepatoprotective diet in reversibility of NAFLD. - NIL
开始日期2025-03-31 |
申办/合作机构- |
ITMCTR2025000512
A randomized double-blind placebo-controlled multicenter clinical study on the efficacy and safety of Xuezhikang capsules in NAFL combined with hyperlipidemia.
开始日期2025-03-31 |
申办/合作机构- |
100 项与 非酒精性脂肪肝 相关的临床结果
登录后查看更多信息
100 项与 非酒精性脂肪肝 相关的转化医学
登录后查看更多信息
0 项与 非酒精性脂肪肝 相关的专利(医药)
登录后查看更多信息
2,030
项与 非酒精性脂肪肝 相关的文献(医药)2025-12-31·Annals of Medicine
Lipid profile and non-alcoholic fatty liver disease detected by ultrasonography: is systemic inflammation a necessary mediator?
Article
作者: Huang, Hongying ; Feng, Wenting ; Tse, Lap Ah ; Li, Wenzhen ; Li, Zhimin ; Kwan, Mei-Po ; Wang, Feng
2025-08-01·Biosensors and Bioelectronics
Dual-channel fluorescent probe for simultaneously visualizing ONOO− and viscosity in epilepsy, non-alcoholic fatty liver and tumoral ferroptosis models
Article
作者: Yu, Xue ; Dong, Chuan ; Huang, Yue ; Shuang, Shaomin ; Zan, Qi ; Zhang, Yuewei ; Fan, Li ; Wang, Rui ; Wang, Hui
2025-07-01·Medicina de Familia. SEMERGEN
Encuesta sobre los conocimientos de la enfermedad hepática metabólica (EHMet) entre los médicos de Atención Primaria en España
Article
作者: García Garrido, A B ; Fontanillas Garmilla, N ; Fernández Jorde, S ; Expósito Martínez, C ; Crespo García, J
393
项与 非酒精性脂肪肝 相关的新闻(医药)2025-05-02
IDF 2025微专辑扫描二维码可查看更多内容编者按:在全球糖尿病负担持续加重的背景下,国际糖尿病联盟世界糖尿病大会(IDF 2025)以“塑造糖尿病的未来(Shape the future of diabetes)”为主题,汇聚了全球学者共话糖尿病新进展、新技术、新策略,为全球糖尿病防治事业注入新动力。值此机会,《国际糖尿病》独家“遇见IDF·每日精粹”直播间特别采访IDF主席Peter Schwarz教授,并围绕糖尿病防控的挑战及应对策略、关爱糖尿病患者的幸福感、人工智能(AI)助力糖尿病的综合防治等关键问题展开深入探讨。糖尿病防控的挑战及IDF的应对策略《国际糖尿病》Q1您认为当前全球糖尿病防控面临的最大挑战是什么?Peter Schwarz 教授:全球糖尿病防控的核心挑战在于低/极低收入国家的医疗资源配置,特别是农村地区糖尿病的早期筛查与管理。这一挑战体现在糖尿病的识别机制、诊断体系及最终保障治疗的可持续供给。从流行病学视角分析,当前及未来数年糖尿病负担由欧美发达地区转向东南亚及非洲地区。在糖尿病发病率持续攀升的现况下,多数卫生系统面临医疗资源短缺与公共卫生政策调整滞后的双重困境。此外,中低收入国家的偏远地区T1DM未确诊率仍处较高水平,胰岛素获取与专科护理资源存在系统性缺口,慢性病长期管理机制尚未完善。卫生政策分析表明,多数国家卫生服务体系尚未完成向慢性病综合管理转型,折射出生活方式变迁与医疗体系响应效能的结构性矛盾。《国际糖尿病》Q2作为IDF主席,IDF应采取哪些有效策略来应对这些挑战和问题?Peter Schwarz 教授:IDF致力于构建应对代谢性疾病挑战的创新机制——提出建立糖尿病与禁食国际联合工作组。当前全球存在对新型高价药物过度依赖的现象,这对中低收入国家构成严峻挑战,可能增加20~30倍的成本,在资源有限地区的持续性存疑。周期性禁食干预已经展现出潜在的转化价值,本届大会已组建专家委员会评估19种禁食模式的证据,构建其在T2DM管理中的应用框架。精准分型方面,在东南亚及非洲地区广泛存在的“5型糖尿病”(暂定名:营养不良相关性糖尿病)需重新进行表型定义。其发病机制可追溯至母体妊娠期营养不良导致的子代胰岛β细胞数量发育缺陷。基于此,跨学科专家组正在制定区别于传统分型的诊断标准,预计18~24个月内完成完整的临床路径构建,这具有重要的临床意义。技术创新层面,重点推进人工智能技术在糖尿病管理中的转化应用:①开发基于深度学习的临床决策支持系统,优化治疗方案生成算法;②构建智能患者教育平台,实现个性化健康管理干预。而低成本的连续血糖监测技术(CGMS)的普适化应用将引发糖尿病管理范式变革。作为全球权威学术组织,IDF已启动医疗质量改进计划,其核心目标是通过技术创新与资源整合,建立适应不同经济发展水平的糖尿病分级诊疗体系,重点解决卫生资源分配的区域性失衡问题。关爱糖尿病患者的幸福感《国际糖尿病》Q3您认为未来IDF将如何推动将“患者幸福感”纳入医疗系统的核心护理目标?Peter Schwarz 教授:IDF将“糖尿病与主观幸福感”作为2024~2026年世界糖尿病日的核心主题,是因为主观幸福感能预测糖尿病患者的临床结局。糖尿病患者心理受自身认知和治疗方式的共同影响——初期对病情不了解产生的心理盲区及长期治疗压力。数据显示糖尿病患者抑郁风险增加3~4倍,75%的病程超5年者会出现倦怠综合征。对于糖尿病患者而言,生活质量的提升应优先于代谢控制,且具有正向的交互效应。今年的世界糖尿病日(11月14日)聚焦“健康福祉与工作场所”,这是一个与众不同的主题却与糖尿病管理一脉相承。工作场所作为特殊环境,能够帮助我们更早发现糖尿病风险人群或高血糖患者,并提供干预措施。例如,全球许多国家的职业健康体系非常完善,有些甚至优于普通医疗系统。职业健康体系通过早期筛查和管理,能有效改善糖尿病患者的职场表现并降低健康风险。《国际糖尿病》Q4聚焦于“幸福感”,加拿大多伦多大学医学院Alice Cheng教授也强调了,该问题在亚洲的年轻人群中的特殊重要性。对此您怎么看待?Peter Schwarz 教授:亚洲与非洲的糖尿病发展轨迹确实与欧美截然不同——病情进展更迅猛、发病年龄更年轻化。以印度为例,尽管素食主义普遍(这通常被视为健康的生活方式),但若大量使用高温(>130℃)油炸碳水化合物,会引发肝脏糖异生障碍进而出现非酒精性脂肪肝等。在东南亚地区,BMI指数仅24kg/m2的28岁女性就可能出现严重代谢紊乱,比欧洲患者提前了近15年。这不仅是医学问题,更是涉及食品工业、城市规划、健康教育的社会系统工程。正如IDF所强调的——破解亚洲糖尿病困局,需要建立“数据驱动的精准公共卫生响应机制”。AI助力糖尿病的综合防治《国际糖尿病》Q5当前,AI炙手可热,请您分享数字健康工具和AI在糖尿病预防与管理中的具体应用案例?Peter Schwarz 教授:糖尿病管理的未来需要双轨并进:AI与数字化医疗的深度融合。我和德国研究团队正在系统评估糖尿病数字疗法——德国在这方面的优势在于,其糖尿病预防与管理数字工具已形成完整的监管认证体系。让糖尿病患者口袋里的智能手机成为健康管理中枢具有巨大的战略意义。人们每天需做近1800项决策,其中450项与生活方式相关。试想,若基于智能手机的AI应用,能在恰当时间以精准的个性化内容,对其中10项关键决策产生积极影响,这种“微干预”的累积效应将重塑疾病管理范式。智能手机承载的微决策引导系统,不仅在糖尿病治疗中举足轻重,更在预防领域展现出革命性潜力。而要实现这一愿景,必须突破AI技术的整合瓶颈。本次大会我们特别成立“AI与糖尿病”专业委员会,旨在构建全球首个AI糖尿病管理证据体系——以患者需求为导向,开发能聚合多源数据(动态血糖、可穿戴设备、环境传感器等)的智能中枢系统,通过机器学习构建个性化的干预模型。试想,若低成本葡萄糖传感器未来能够普及,这首先要感谢中国在传感器技术创新上的推动——目前正是这些创新显著降低了现有传感器的价格。当患者通过这种经济型筛查设备获取海量数据时,我们将能深入洞悉其生活习惯。此时的关键就在于如何利用这些数据,而AI正是解决方案。AI能够整合分析血糖值、运动量、情绪波动、睡眠质量等多元数据,无需人工输入即可自动解读健康信号,精准指出哪些行为有益、哪些存在风险,并为患者提供个性化建议。这种以糖尿病患者个体需求为核心的技术发展前景广阔、意义深远。结语未来已来,智能手机搭载AI应用,实时汇聚各类生理数据,并将其转化为个性化的健康管理方案,有望为糖尿病管理提供有力支持。声明:本文仅供医疗卫生专业人士了解最新医药资讯参考使用,不代表本平台观点。该等信息不能以任何方式取代专业的医疗指导,也不应被视为诊疗建议,如果该信息被用于资讯以外的目的,本站及作者不承担相关责任。最新《国际糖尿病》读者专属微信交流群建好了,快快加入吧!扫描左边《国际糖尿病》小助手二维码(微信号:guojitnb),回复“国际糖尿病读者”,ta会尽快拉您入群滴!(来源:《国际糖尿病》编辑部)版权声明版权属《国际糖尿病》所有。欢迎个人转发分享。其他任何媒体、网站未经授权,禁止转载。
临床研究
2025-04-24
关注并星标CPHI制药在线4月23日,南京正大天晴制药有限公司递交的佩玛贝特片的4类仿制药上市申请获CDE受理,这意味着国内佩玛贝特片首仿报产。原研佩玛贝特(pemafibrate,Parmodia)是日本兴和株式会社(Kowa Company)开发的一种新型、高选择性的过氧化物酶体增殖物激活受体α(PPARα)调节剂,通过与PPARα结合并调节参与脂质代谢的基因表达,显著改善血脂代谢。佩玛贝特能有效降低血浆甘油三酯(TG)水平,同时增加高密度脂蛋白胆固醇(HDL-C)水平,并对其他血脂指标产生积极影响。佩玛贝特被开发用于治疗高脂血症、非酒精性脂肪肝、高胆固醇血症和原发性胆汁性胆管炎等疾病。2022年11月《新英格兰医学杂志》(NEJM)上发表的PROMINENT试验结果显示:在合并2型糖尿病、TG轻中度升高(200~499mg/dl)、HDL-C水平偏低(≤40mg/dl),且均接受他汀类药物治疗的患者中,与安慰剂相比,佩玛贝特在4个月内将中位TG水平降低了26.2%,且对HDL-C等其他血脂参数也有积极改善。但相比安慰剂,在该研究中接受佩玛贝特治疗的患者的心血管事件发生率并没有降低。2017年7月,原研佩玛贝特普通片在日本获批治疗高脂血症。2023年6月,佩玛贝特的新剂型缓释片在日本获批治疗高脂血症(含家族性高脂血症)。相比佩玛贝特片每日口服2次,佩玛贝特缓释片给药更加方便,仅需口服1次。佩玛贝特上市后表现亮眼,据悉其2020年在日本的市场销售额就已超过非诺贝特,达到6510万美元,显示出良好的市场潜力。据IMS数据,2023年佩玛贝特片在日本的销售额达1.12亿美元,增长率10.83%。在国内,原研佩玛贝特片于2025年4月14日获批,用于治疗高脂血症(包括家族性高脂血症)。不足10日,国内就有佩玛贝特片仿制药报产,可见佩玛贝特片市场竞争十分激烈。相关阅读:《降脂新药佩玛贝特中国获批,能否重塑血脂治疗格局?》实际上,佩玛贝特仿制药竞争早就暗流涌动。据公开资料,佩玛贝特原研化合物专利于2024年9月到期,制剂组合物专利于2034年8月到期。据CDE官网药物临床试验登记与信息公示平台,国内已登记21项佩玛贝特片BE试验,其中12项已完成。南京正大天晴作为国内首家递交佩玛贝特片仿制药上市申请的企业,若顺利有望斩获佩玛贝特片首仿资格。这不仅可能改变当前血脂异常治疗的市场格局,也将为广大患者带来更多治疗选择和更具性价比的治疗方案 ,进一步提高患者的用药可及性。除面临仿制药竞争,佩玛贝特在血脂异常领域还面临着来自其他药物的竞争。佩玛贝特在降低TG方面疗效优异,而国内降低TG最常用的是贝特类药物,如苯扎贝特、非诺贝特、吉非罗齐、环丙贝特。但与传统贝特类药物非诺贝特相比,佩玛贝特对PPARα的选择性高2500倍,可大幅减少肝毒性和肌肉损伤等副作用风险。贝特类药物主要通过抑制内源性TG合成,降低血清TG、升高高密度脂蛋白(一种对抗动脉粥样硬化的脂蛋白)水平,促进极低密度脂蛋白和TG的分解,促进胆固醇从周围组织转运到肝脏代谢。而且,贝特类还有有抗血栓和抗炎作用等非调脂作用。据米内网数据,2022年全国贝特类药物销售额达8.1亿元,且呈逐年上升的趋势。此外,国内近年还批准了一些新的降脂药物,如新型PCSK9抑制剂(阿利西尤单抗、托莱西单抗等)。据悉国产PCSK9抑制剂的年治疗费用已降至2万元以下,未来佩玛贝特要想侵蚀PCSK9抑制剂市场,有可能会打价格战,尤其是未来随着国产佩玛贝特的获批上市。END【企业推荐】领取CPHI & PMEC China 2025展会门票来源:CPHI制药在线声明:本文仅代表作者观点,并不代表制药在线立场。本网站内容仅出于传递更多信息之目的。如需转载,请务必注明文章来源和作者。投稿邮箱:Kelly.Xiao@imsinoexpo.com▼更多制药资讯,请关注CPHI制药在线▼点击阅读原文,进入智药研习社~
专利到期
2025-04-17
·药事纵横
4月14日,日本兴和制药(Kowa Company)研发的佩玛贝特片(Pemafibrate)正式获得中国国家药监局(NMPA)批准,用于治疗血脂异常。图源:NMPA官网佩玛贝特的核心竞争力体现在其对甘油三酯(TG)的显著降低效果。作为高选择性PPARα激动剂,它对PPARα的亲和力比传统药物非诺贝特高出2500倍,这使得其降低TG的效果达到50%,而在他汀类药物基础上联合使用时,仍能进一步降低中位TG水平26.2%。在中国本土的临床试验中,0.4 mg剂量的佩玛贝特使患者TG水平下降44%,甚至优于非诺贝特的30.5%。这种效果对以高TG为特征的血脂异常患者(如糖尿病合并血脂异常人群)尤其重要,因为现有药物往往难以兼顾疗效与安全性。对于医生和患者而言,佩玛贝特的吸引力在于其安全性。传统贝特类药物可能引起肝功能异常或肌酸激酶升高,而佩玛贝特在中国3期临床试验中显示,使用后ALT、AST等肝脏指标反而有所下降,且对肾功能损害患者无需调整剂量。这使得它特别适合需长期用药的慢性病患者。临床实践中,医生可能优先在以下场景使用佩玛贝特:他汀治疗后TG仍高于200 mg/dl的患者、贝特类药物不耐受者、合并脂肪肝或糖尿病的复杂病例。争议焦点:为何“降脂成功”却未能减少心血管事件?尽管血脂指标显著改善,研究却未观察到心血管事件(如心梗、中风)发生率的降低。这一结果与传统认知相悖——长期以来,降低TG和提升HDL-C被视为预防心血管疾病的关键策略。为何指标改善未能转化为临床获益?对此,学界提出几种解释:一是残余风险的多因素性。心血管事件受LDL-C、炎症、血栓形成等多因素影响,单纯降低TG可能不足以抵消其他风险因素的作用。例如,佩玛贝特虽降低TG,但未能显著改变富含胆固醇的残粒脂蛋白水平,这类颗粒可能更直接促进动脉粥样硬化。二是患者人群的异质性。PROMINENT试验纳入的是已接受他汀治疗且LDL-C控制较好的2型糖尿病患者。这类患者的残余风险可能更多来自胰岛素抵抗、氧化应激等非血脂因素,单纯降TG效果有限。三是生物标志物与临床终点的脱节。该现象提示,TG作为生物标志物的临床意义可能需要重新评估。有学者指出,某些药物,如ω-3脂肪酸,虽降TG幅度较小,却可能通过抗炎等机制带来心血管获益,而佩玛贝特的作用可能局限于代谢层面。尽管存在争议,佩玛贝特在中国的获批仍具有重要商业价值。目前中国降脂药市场规模已超百亿元,而他汀类药物占据主导地位,但约30%的患者存在他汀治疗后TG仍未达标的问题,这为佩玛贝特提供了市场切入点。从竞争格局看,佩玛贝特需直面三类对手:传统贝特类药物(如非诺贝特)、新型PCSK9抑制剂(如阿利西尤单抗)以及国产创新药(如信达生物的托莱西单抗)。在日本市场,佩玛贝特上市仅三年便超越非诺贝特,2020年销售额达6510万美元,显示出强劲的市场渗透力。不过,其在中国能否复制这一成功,取决于定价策略。参考日本定价,佩玛贝特的日均费用约为非诺贝特的3倍,而国产PCSK9抑制剂的年治疗费用已降至2万元以下,这对患者的支付意愿构成挑战。因此,兴和制药可能采取“阶梯定价”策略,初期瞄准高端市场,后期通过医保谈判扩大覆盖面。此外,佩玛贝特的剂型优势也不容忽视。2023年,其缓释片在日本获批,将服药频率从每日两次降至一次,极大提升了用药便利性。若未来在中国推出缓释剂型,可能进一步巩固其市场地位。同时,兴和制药正在探索佩玛贝特在非酒精性脂肪肝、原发性胆汁性胆管炎等适应症的潜力,这些领域的临床需求尚未被充分满足,有望成为新的增长点。佩玛贝特的获批带给我们启示,未来的研究方向可能集中在三方面:一是通过生物标志物(如APOC3基因型)筛选对TG降低敏感的患者亚群;二是探索与其他药物的联合疗法,例如与PCSK9抑制剂联用,同时靶向LDL-C和TG;三是拓展非血脂适应症,如非酒精性脂肪肝的治疗。值得注意的是,佩玛贝特在日本的适应症已扩展至家族性高脂血症,而中国尚未批准这一适应症,这为后续市场扩容留下空间。佩玛贝特片的获批,标志着中国血脂管理进入“精准降脂”时代。它带来的不仅是新的治疗选择,更是对现有临床思维的挑战,降脂药物的价值不能仅凭生物标志物的改善来判定,而需以硬终点为导向。未来,如何将这类药物纳入个体化治疗路径,如何平衡疗效、安全性与经济性,将成为医疗决策的核心课题。[1]Das Pradhan A, Glynn RJ, Fruchart JC, et al. Triglyceride Lowering with Pemafibrate to Reduce Cardiovascular Risk. New England Journal of Medicine. 2022;387(21):1923-1934. doi:10.1056/NEJMoa2210645.[2]中国药物临床试验登记与信息公示平台. 评估佩玛贝特在中国高TG和低HDL-C患者中的有效性和安全性的III期研究(CTR20211983)(2021-12-01)[2025-04-15]. https://www.chinadrugtrials.org.cn/.[3]国家药品监督管理局(NMPA).药事纵横投稿须知:稿费已上调,欢迎投稿
临床3期
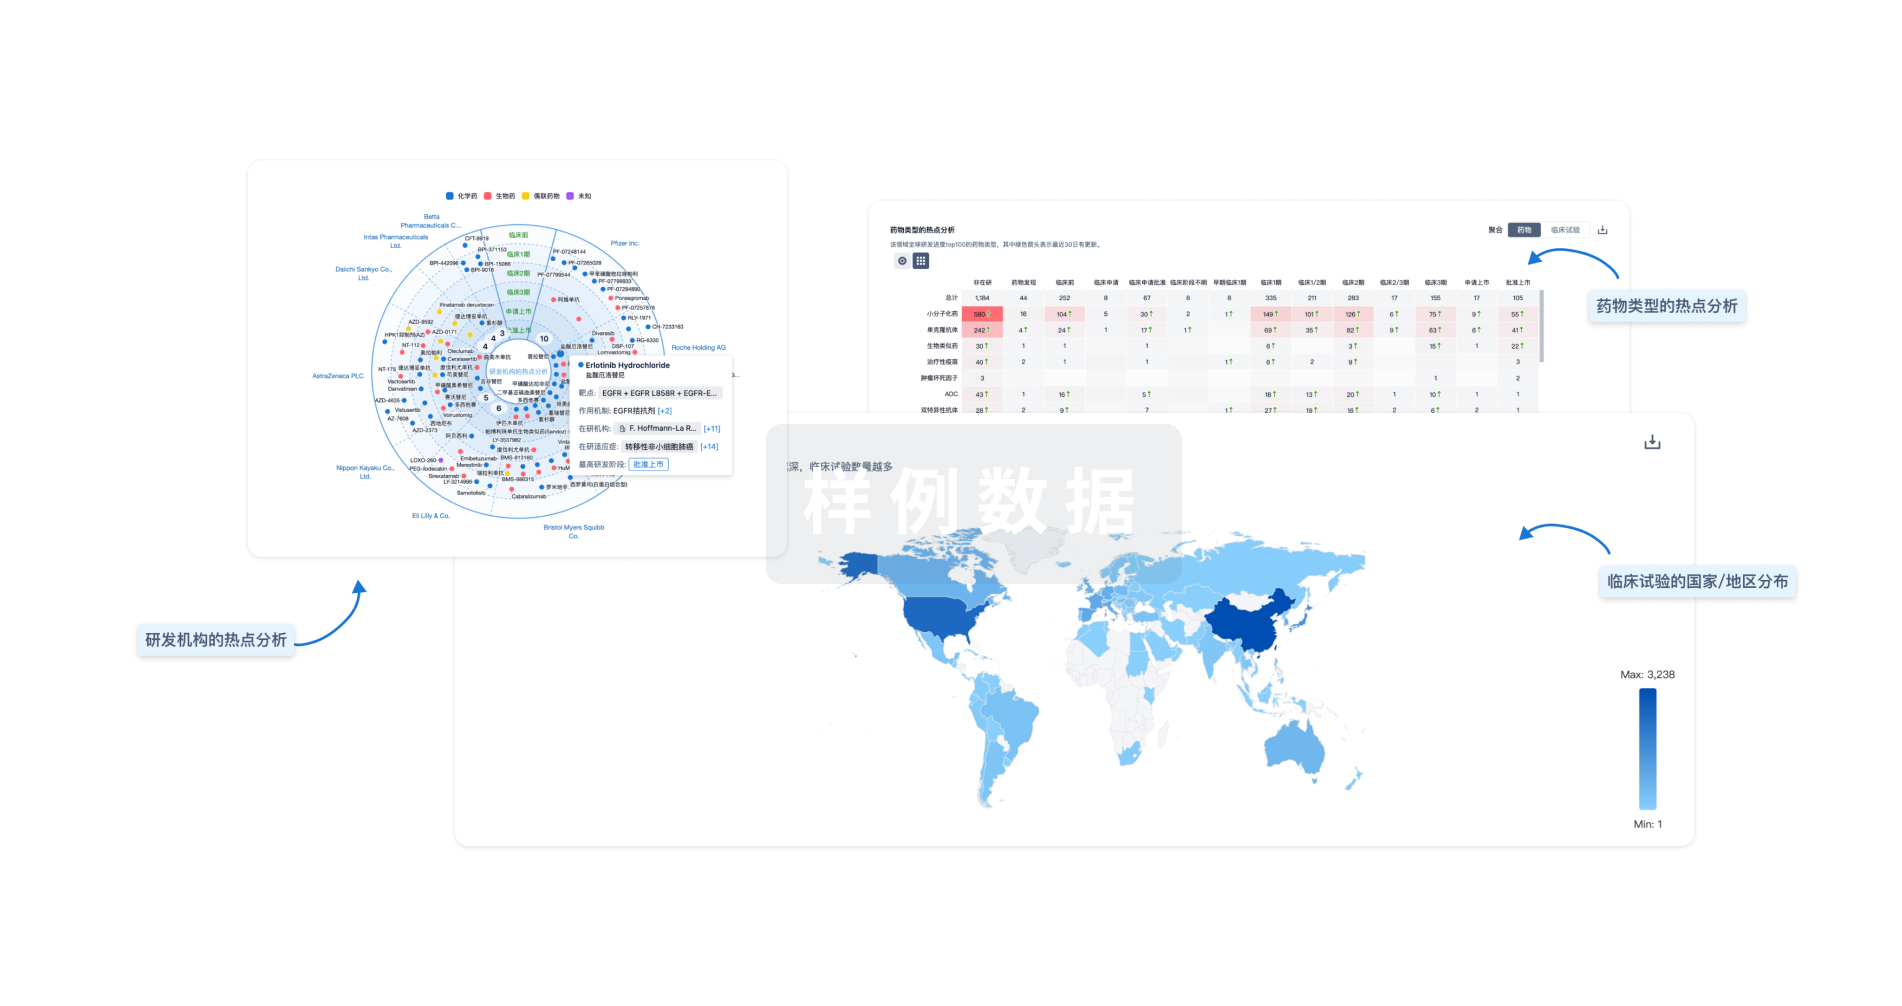
分析
对领域进行一次全面的分析。
登录
或

Eureka LS:
全新生物医药AI Agent 覆盖科研全链路,让突破性发现快人一步
立即开始免费试用!
智慧芽新药情报库是智慧芽专为生命科学人士构建的基于AI的创新药情报平台,助您全方位提升您的研发与决策效率。
立即开始数据试用!
智慧芽新药库数据也通过智慧芽数据服务平台,以API或者数据包形式对外开放,助您更加充分利用智慧芽新药情报信息。
生物序列数据库
生物药研发创新
免费使用
化学结构数据库
小分子化药研发创新
免费使用


