预约演示
更新于:2025-05-07

Acrux Ltd.
更新于:2025-05-07
概览
标签
感染
小分子化药

关联
4
项与 Acrux Ltd. 相关的药物靶点 |
作用机制 AR激动剂 |
原研机构 |
最高研发阶段批准上市 |
首次获批国家/地区 美国 |
首次获批日期1995-09-29 |

靶点- |
作用机制- |
在研机构 |
原研机构 |
在研适应症 |
非在研适应症- |
最高研发阶段临床前 |
首次获批国家/地区- |
首次获批日期- |
靶点- |
作用机制- |
在研机构- |
在研适应症- |
非在研适应症 |
最高研发阶段终止 |
首次获批国家/地区- |
首次获批日期- |
12
项与 Acrux Ltd. 相关的临床试验NCT01172366
A Phase I Study to Evaluate the Potential for Interpersonal Transfer of Testosterone Following Single Dose Application of 2% Testosterone Metered Dose (MD) Lotion®
The hypotheses for this study is that there is no transfer of testosterone from male (donor) subjects to female (recipient) subjects when contact is made 2 hours post application of 2% Testosterone MD-Lotion® if the donor has a covered application area with a T-shirt.
开始日期2010-08-01 |
申办/合作机构 |
NCT00996151
A Healthy Volunteer, Single Dose Phase I Trial to Determine the Amount of Testerone MD-Lotion 2% Remaining on the Axilla After Washing.
The study will evaluate the amount of Testosteron MD-Lotion 2% remaining on the axilla after a single dose application in healthy males who undergo a post dose washing procedure.
开始日期2009-12-01 |
申办/合作机构 |
NCT00857168
A Phase I Trial to Determine the Impact of Application of Antiperspirant and Deodorant as Well as Washing the Application Site, on the Pharmacokinetics of Testosterone Following Single Dose Applications of 2% Testosterone MD-Lotion® (Cutaneous Solution)
Testosterone replacement treatment is the most effective way of treating hypogonadism in men.
Acrux has a propriety testosterone replacement product, Testosterone MD-Lotion and this study will evaluate the impact of application of antiperspirant and deodorant on absorption of testosterone, when applied pre-application of Testosterone MD-Lotion® (cutaneous solution).
The study also aim to evaluate the impact of washing the application site on the absorption of testosterone, when washed post-application of Testosterone MD-Lotion® (cutaneous solution).
开始日期2009-01-01 |
申办/合作机构 |
100 项与 Acrux Ltd. 相关的临床结果
登录后查看更多信息
0 项与 Acrux Ltd. 相关的专利(医药)
登录后查看更多信息
13
项与 Acrux Ltd. 相关的文献(医药)2022-05-01·International Journal of Pharmaceutics2区 · 医学
The history of a transdermal product: From innovation to generic
2区 · 医学
Review
作者: Colagrande, F ; Watkinson, A C
2014-10-01·Clinical Therapeutics4区 · 医学
Application Site Affects the Pharmacokinetics of Topical Testosterone Applied to the Axilla Compared With the Inner Arm
4区 · 医学
Article
作者: Evans, Allan M ; Davis, Susan R ; Humberstone, Andrew
2006-03-01·Journal of Aerosol Medicine
Systemic Delivery of Drugs to Humans via Inhalation
Review
作者: Gonda, Igor
4
项与 Acrux Ltd. 相关的新闻(医药)2024-07-17
STATEN ISLAND, N.Y., July 17, 2024 /PRNewswire/ -- Acurx Pharmaceuticals, Inc. (NASDAQ: ACXP) ("Acurx" or the "Company"), a late-stage biopharmaceutical company developing a new class of small molecule antibiotics for difficult-to-treat bacterial infections, today announced that a new patent has been granted by the United States Patent and Trademark Office (USPTO) on July 16, 2024. This patent relates to ibezapolstat and its use to treat C. difficile Infection (CDI) while reducing the recurrence of the infection, as well as improving the health of the gut microbiome. This is the latest in the series of granted patents and pending patent applications that Acrux has filed to protect its proprietary technologies in the field of antimicrobials.
Robert J. DeLuccia, Executive Chairman of Acurx, stated: "This patent is very important and timely as ibezapolstat continues to demonstrate previously unexpected and favorable effects on the gut microbiome while at the same time curing the C. difficile bacterial infection and preventing recurrent infection." He further added: "As we continue to prepare for initiation of our Phase 3 clinical program, we expect this feature of ibezapolstat's selective mechanism of action to be further demonstrated and to be an important competitive advantage over currently available antibiotics by reducing the recurrence of the infection. This could have a dramatically favorable effect on patient outcomes and on reducing downstream healthcare costs."
David P. Luci, President & CEO of Acurx stated: "This latest patent is part of our company's pivotal product, ibezapolstat, which is a two-dimensional antibiotic to cure infections clinically comparable to marketed antibiotics while restoring the microbiome and preventing reinfections which is unusually positive for CDI antibiotics."
Acurx has previously announced that it had a successful FDA End-of- Phase 2 Meeting and Phase 3 Readiness for ibezapolstat for the Treatment of C. difficile Infection. Agreement with FDA was reached on key elements to move forward with its international Phase 3 clinical trial program. Agreement was also reached with FDA on the complete non-clinical and clinical development plan for filing of a New Drug Application (NDA) for marketing approval. Planning continues to advance ibezapolstat into international Phase 3 clinical trials for treatment of C. difficile Infection (CDI). Acurx is also now preparing to submit requests for guidance to initiate clinical trials in the European Union, the United Kingdom, Japan and Canada.
About the Ibezapolstat Phase 2 Clinical Trial
The completed multicenter, open-label single-arm segment (Phase 2a) study was followed by a double-blind, randomized, active-controlled, non-inferiority, segment (Phase 2b) at 28 US clinical trial sites which together comprise the Phase 2 clinical trial. (see ). This Phase 2 clinical trial was designed to evaluate the clinical efficacy of ibezapolstat in the treatment of CDI including pharmacokinetics and microbiome changes from baseline and continue to test for anti-recurrence microbiome properties seen in the Phase 2a trial, including the treatment-related changes in alpha diversity and bacterial abundance and effects on bile acid metabolism.
Key elements for the two Phase 3, non-inferiority, pivotal trials were confirmed and included agreement on the protocol design, patient population, primary and secondary endpoints, and size of the registration safety database. Based on FDA recommendations, and in anticipation of an EMA Scientific Advice Meeting, the primary efficacy analysis will be performed using a Modified Intent-To-Treat (mITT) population consistent with EMA requirements. This will result in an estimated 450 subjects in the mITT population, randomized in a 1:1 ratio to either ibezapolstat or standard-of-care vancomycin, enrolled into the initial Phase 3 trial. The trial design not only allows determination of ibezapolstat's ability to achieve Clinical Cure of CDI as measured 2 days after 10 days of oral treatment, but also includes assessment of ibezapolstat's potential effect on reduction of CDI recurrence in the target population. In the event non-inferiority of ibezapolstat to vancomycin is demonstrated, further analysis will be conducted to test for superiority.
The completed Phase 2a segment of this trial was an open label cohort of up to 20 subjects from study centers in the United States. In this cohort, 10 patients with diarrhea caused by C. difficile were treated with ibezapolstat 450 mg orally, twice daily for 10 days. All patients were followed for recurrence for 28± 2 days. Per protocol, after 10 patients of the projected 20 Phase 2a patients completed treatment (100% cured infection at End of Treatment), the Trial Oversight Committee assessed the safety and tolerability and made its recommendation regarding early termination of the Phase 2a study and advancement to the Ph2b segment. The Company's Scientific Advisory Board concurred with this recommendation.
In the now completed Phase 2b trial segment, 32 patients with CDI were enrolled and randomized in a 1:1 ratio to either ibezapolstat 450 mg every 12 hours or vancomycin 125 mg orally every 6 hours, in each case, for 10 days and followed for 28 ± 2 days following the end of treatment for recurrence of CDI. The two treatments were identical in appearance, dosing times, and number of capsules administered to maintain the blind. The Company previously reported that the overall observed Clinical Cure rate in the combined Phase 2 trials in patients with CDI was 96% (25 out of 26 patients), based on 10 out of 10 patients (100%) in Phase 2a in the Modified Intent to Treat Population, plus 15 out of 16 (94%) patients in Phase 2b in the Per Protocol Population, who experienced Clinical Cure during treatment with ibezapolstat. Ibezapolstat was well-tolerated, with three patients each experiencing one mild adverse event assessed by the blinded investigator to be drug-related. All three events were gastrointestinal in nature and resolved without treatment.
There were no drug-related treatment withdrawals or no drug-related serious adverse events, or other safety findings of concern. In the Phase 2b vancomycin control arm, 14 out of 14 patients experienced Clinical Cure. The Company is confident that based on the pooled Phase 2 ibezapolstat Clinical Cure rate of 96% and the historical vancomycin cure rate of approximately 81% (Vancocin® Prescribing Information, January 2021), we will demonstrate non-inferiority of ibezapolstat to vancomycin in Phase 3 trials in accordance with the applicable FDA Guidance for Industry (October 2022).
The Phase 2b clinical trial segment was discontinued due to success. The Company made this decision in consultation with its medical and scientific advisors and statisticians based on observed aggregate blinded data and other factors, including the cost to maintain clinical trial sites and slow enrollment due to COVID-19 and its aftermath. The Company had determined that the trial performed as anticipated for both treatments, ibezapolstat and the control antibiotic vancomycin (a standard of care to treat patients with CDI), with high rates of clinical cure observed across the trial.
The Phase 2b trial was originally designed to be a non-inferiority (NI) trial and later amended to include an interim efficacy analysis with review by an Independent Data Monitoring Committee (IDMC). The decision to end the trial early based on blinded clinical observations obviated the need for an interim analysis, IDMC review, and NI assessment. The Company determined, in consultation with its clinical and statistical experts, that presenting clinical cure rates for the primary efficacy endpoint is the most appropriate representation for the clinical activity of ibezapolstat in treating CDI.
In the Phase 2 clinical trial, the Company will also evaluate pharmacokinetics (PK) and microbiome changes and test for anti-recurrence microbiome properties, including the change from baseline in alpha diversity and bacterial abundance, especially overgrowth of healthy gut microbiota Actinobacteria and Firmicute phylum species during and after therapy. Phase 2a data demonstrated complete eradication of colonic C. difficile by day three of treatment with ibezapolstat as well as the observed overgrowth of healthy gut microbiota, Actinobacteria and Firmicute phyla species, during and after therapy. Very importantly, emerging data show an increased concentration of secondary bile acids during and following ibezapolstat therapy which is known to correlate with colonization resistance against C. difficile. A decrease in primary bile acids and the favorable increase in the ratio of secondary-to-primary bile acids suggest that ibezapolstat may reduce the likelihood of CDI recurrence when compared to vancomycin. The company also recently reported positive extended clinical cure (ECC) data for ibezapolstat (IBZ), its lead antibiotic candidate, from the Company's recently completed Phase 2b clinical trial in patients with CDI. This exploratory endpoint showed that 12 patients who agreed to be followed up to three months following Clinical Cure of their infection, 5 of 5 IBZ patients experienced no recurrence of infection. In the vancomycin control arm of the trial, 7 of 7 patients experienced no recurrence of infection. ECC success is defined as a clinical cure at the TOC visit (i.e., at least 48 hours post EOT) and no recurrence of CDI within the 56 ± 2 days post EOT (ECC56) and 84 ± 2 days post EOT (ECC84) in patients who consented to extended observation. In the Phase 2b trial, 100% (5 of 5) of ibezapolstat-treated patients who agreed to observation for up to three months following Clinical Cure of CDI experienced no recurrence of infection.
About Ibezapolstat
Ibezapolstat is the Company's lead antibiotic candidate planning to advance to international Phase 3 clinical trials to treat patients with C. difficile Infection (CDI). Ibezapolstat is a novel, orally administered antibiotic being developed as a Gram-Positive Selective Spectrum (GPSS®) antibacterial. It is the first of a new class of DNA polymerase IIIC inhibitors under development by Acurx to treat bacterial infections. Ibezapolstat's unique spectrum of activity, which includes C. difficile but spares other Firmicutes and the important Actinobacteria phyla, appears to contribute to the maintenance of a healthy gut microbiome.
In June 2018, ibezapolstat was designated by the U.S. Food and Drug Administration (FDA) as a Qualified Infectious Disease Product (QIDP) for the treatment of patients with CDI and will be eligible to benefit from the incentives for the development of new antibiotics established under the Generating New Antibiotic Incentives Now (GAIN) Act. In January 2019, FDA granted "Fast Track" designation to ibezapolstat for the treatment of patients with CDI. The CDC has designated C. difficile as an urgent threat highlighting the need for new antibiotics to treat CDI.
About Clostridioides difficile Infection (CDI).
According to the 2017 Update (published February 2018) of the Clinical Practice Guidelines for C. difficile Infection by the Infectious Diseases Society of America (IDSA) and Society or Healthcare Epidemiology of America (SHEA), CDI remains a significant medical problem in hospitals, in long-term care facilities and in the community. C. difficile is one of the most common causes of healthcare-associated infections in U.S. hospitals (Lessa, et al, 2015, New England Journal of Medicine). Recent estimates suggest C. difficile approaches 500,000 infections annually in the U.S. and is associated with approximately 20,000 deaths annually. (Guh, 2020, New England Journal of Medicine). Based on internal estimates, the recurrence rate for the antibiotics currently used to treat CDI is between 20% and 40% among approximately 150,000 patients treated. We believe the annual incidence of CDI in the U.S. approaches 600,000 infections and a mortality rate of approximately 9.3%.
About the Microbiome in C. difficile Infection (CDI) and Bile Acid Metabolism
C. difficile can be a normal component of the healthy gut microbiome, but when the microbiome is thrown out of balance, the C. difficile can thrive and cause an infection. After colonization with C. difficile, the organism produces and releases the main virulence factors, the two large clostridial toxins A (TcdA) and B (TcdB). (Kachrimanidou, Microorganisms 2020, 8, 200; doi:10.3390/microorganisms8020200.) TcdA and TcdB are exotoxins that bind to human intestinal epithelial cells and are responsible for inflammation, fluid and mucous secretion, as well as damage to the intestinal mucosa.
Bile acids perform many functional roles in the GI tract, with one of the most important being maintenance of a healthy microbiome by inhibiting C. difficile growth. Primary bile acids, which are secreted by the liver into the intestines, promote germination of C. difficile spores and thereby increase the risk of recurrent CDI after successful treatment of an initial episode. On the other hand, secondary bile acids, which are produced by normal gut microbiota through metabolism of primary bile acids, do not induce C. difficile sporulation and therefore protect against recurrent disease. Since ibezapolstat treatment leads to minimal disruption of the gut microbiome, bacterial production of secondary bile acids continues which may contribute to an anti-recurrence effect. Beneficial effects of bile acids include a decrease in primary bile acids and an increase in secondary bile acids in patients with CDI, which was observed in the Company's Ph2a trial results and previously reported (CID, 2022).
About Acurx Pharmaceuticals, Inc.
Acurx Pharmaceuticals is a late-stage biopharmaceutical company focused on developing a new class of small molecule antibiotics for difficult-to-treat bacterial infections. The Company's approach is to develop antibiotic candidates with a Gram-positive selective spectrum (GPSS®) that blocks the active site of the Gram+ specific bacterial enzyme DNA polymerase IIIC (pol IIIC), inhibiting DNA replication and leading to Gram-positive bacterial cell death. Its R&D pipeline includes antibiotic product candidates that target Gram-positive bacteria, including Clostridioides difficile, methicillin-resistant Staphylococcus aureus (MRSA), vancomycin resistant Enterococcus (VRE) and drug-resistant Streptococcus pneumoniae (DRSP).
To learn more about Acurx Pharmaceuticals and its product pipeline, please visit
Forward-Looking Statements
Any statements in this press release about our future expectations, plans and prospects, including statements regarding our strategy, future operations, prospects, plans and objectives, and other statements containing the words "believes," "anticipates," "plans," "expects," and similar expressions, constitute forward-looking statements within the meaning of The Private Securities Litigation Reform Act of 1995. Actual results may differ materially from those indicated by such forward-looking statements as a result of various important factors, including: whether ibezapolstat will benefit from the QIDP designation; whether ibezapolstat will advance through the clinical trial process on a timely basis; whether the results of the clinical trials of ibezapolstat will warrant the submission of applications for marketing approval, and if so, whether ibezapolstat will receive approval from the FDA or equivalent foreign regulatory agencies where approval is sought; whether, if ibezapolstat obtains approval, it will be successfully distributed and marketed; and other risks and uncertainties described in the Company's annual report filed with the Securities and Exchange Commission on Form 10-K for the year ended December 31, 2022, and in the Company's subsequent filings with the Securities and Exchange Commission. Such forward- looking statements speak only as of the date of this press release, and Acurx disclaims any intent or obligation to update these forward-looking statements to reflect events or circumstances after the date of such statements, except as may be required by law.
Investor Contact:
Acurx Pharmaceuticals, Inc.
David P. Luci, President & CEO
Tel: 917-533 1469
Email: [email protected]
SOURCE Acurx Pharmaceuticals, Inc.
临床2期临床3期临床结果快速通道
2022-09-26
NEW YORK, Sept. 26, 2022 /PRNewswire/ -- One of the key trends in the testosterone replacement therapy market is the
rise in novel therapeutic approaches. Metabolic syndrome can result in testosterone deficiency. It can be treated with anti-inflammatory drugs, which are also used to treat testosterone deficiency. The advent of new therapeutic approaches is leading to frequent market changes. Vendors are focusing on developing alternative treatment options. Thus, the growing focus of vendors on therapeutic approaches is expected to lead to the entry of new products in the global testosterone replacement therapy market, which will drive market growth.
Continue Reading
Technavio has announced its latest market research report titled Global Testosterone Replacement Therapy Market 2022-2026
The testosterone replacement therapy market size is expected to grow by USD 402.87 million from 2021 to 2026. In addition, the growth momentum of the market will accelerate at a CAGR of 3.1% during the forecast period, according to Technavio.
Get a comprehensive report summary describing the market size and forecast along with research methodology. The FREE sample report is available in PDF format
The initiatives to raise awareness about hypogonadism among the population are driving the growth of the testosterone replacement therapy market. However, factors such as the availability of generics may challenge market growth.
Testosterone Replacement Therapy Market: Product Landscape
By product, the market has been segmented into injectables, topicals, and others. The
injectables segment will be the largest contributor to market growth during the forecast period. This growth is attributed to factors such as the prevalence of testosterone deficiency. Some of the major conditions that have been identified as risk factors for testosterone deficiency include diabetes, obesity, metabolic syndrome, and dyslipidemia. Therefore, the rise in the prevalence of testosterone deficiency is expected to accelerate the growth of the global testosterone replacement therapy market during the forecast period.
Testosterone Replacement Therapy Market: Geographic Landscape
By geography, the market has been segmented into North America, Europe, Asia, and the Rest of the World (ROW).
North America is expected to have lucrative growth during the forecast period. About 58% of the market's overall growth is expected to originate from the region. The US and Canada are the key countries for the testosterone replacement therapy market in North America. The growth of the region is attributed to factors such as the rising number of cases of hypogonadism and raising awareness about the treatment of testosterone deficiency and erectile dysfunction.
Companies Covered
AbbVie Inc.
Acerus Pharmaceuticals Corp.
Acrux Ltd.
Actiza Pharmaceutical Pvt. Ltd.
Antares Pharma Inc.
Aytu BioPharma Inc.
Bausch Health Co. Inc.
Bayer AG
BIOTE MEDICAL LLC
Cipla Ltd.
Clarus Therapeutics Inc.
Eli Lilly and Co.
Endo International Plc
Novartis AG
Pfizer Inc.
Sun Pharmaceutical Industries Ltd.
Teva Pharmaceutical Industries Ltd.
The Simple Pharma Co. UK Ltd.
Upsher Smith Laboratories LLC
Viatris Inc.
This report provides a full list of key vendors, their strategies, and the latest developments. Request a FREE PDF Sample Now
What our reports offer
Market share assessments for the regional and country-level segments
Strategic recommendations for the new entrants
Covers market data for 2022, 2022, until 2026
Market trends (opportunities, drivers, threats, challenges, investment opportunities, and recommendations)
Strategic recommendations in key business segments based on the market estimations
Competitive landscaping highlighting the key common trends
Company profiling with detailed strategies, recent developments, and financials
Supply chain trends recording the latest technological advancements
Related Reports
Sexually Transmitted Diseases (STD) Treatment Market by Service and Geography - Forecast and Analysis 2022-2026: The sexually transmitted diseases (STD) treatment market share is expected to increase by USD 13.48 billion from 2021 to 2026.
Sexual Enhancement Supplements Market by Product and Geography - Forecast and Analysis 2022-2026: The sexual enhancement supplements market share is expected to increase by USD 801.29 million from 2021 to 2026.
Browse Health Care Market Reports
Table of Contents
1 Executive Summary
1.1 Market overview
Exhibit 01: Executive Summary – Chart on Market Overview
Exhibit 02: Executive Summary – Data Table on Market Overview
Exhibit 03: Executive Summary – Chart on Global Market Characteristics
Exhibit 04: Executive Summary – Chart on Market by Geography
Exhibit 05: Executive Summary – Chart on Market Segmentation by Product
Exhibit 06: Executive Summary – Chart on Incremental Growth
Exhibit 07: Executive Summary – Data Table on Incremental Growth
Exhibit 08: Executive Summary – Chart on Vendor Market Positioning
2 Market Landscape
2.1 Market ecosystem
Exhibit 09: Parent market
Exhibit 10: Market Characteristics
3 Market Sizing
3.1 Market definition
Exhibit 11: Offerings of vendors included in the market definition
3.2 Market segment analysis
Exhibit 12: Market segments
3.3 Market size 2021
3.4 Market outlook: Forecast for 2021-2026
Exhibit 13: Chart on Global - Market size and forecast 2021-2026 ($ million)
Exhibit 14: Data Table on Global - Market size and forecast 2021-2026 ($ million)
Exhibit 15: Chart on Global Market: Year-over-year growth 2021-2026 (%)
Exhibit 16: Data Table on Global Market: Year-over-year growth 2021-2026 (%)
4 Five Forces Analysis
4.1 Five forces summary
Exhibit 17: Five forces analysis - Comparison between 2021 and 2026
4.2 Bargaining power of buyers
Exhibit 18: Chart on Bargaining power of buyers – Impact of key factors 2021 and 2026
4.3 Bargaining power of suppliers
Exhibit 19: Bargaining power of suppliers – Impact of key factors in 2021 and 2026
4.4 Threat of new entrants
Exhibit 20: Threat of new entrants – Impact of key factors in 2021 and 2026
4.5 Threat of substitutes
Exhibit 21: Threat of substitutes – Impact of key factors in 2021 and 2026
4.6 Threat of rivalry
Exhibit 22: Threat of rivalry – Impact of key factors in 2021 and 2026
4.7 Market condition
Exhibit 23: Chart on Market condition - Five forces 2021 and 2026
5 Market Segmentation by Product
5.1 Market segments
Exhibit 24: Chart on Product - Market share 2021-2026 (%)
Exhibit 25: Data Table on Product - Market share 2021-2026 (%)
5.2 Comparison by Product
Exhibit 26: Chart on Comparison by Product
Exhibit 27: Data Table on Comparison by Product
5.3 Injectables - Market size and forecast 2021-2026
Exhibit 28: Chart on Injectables - Market size and forecast 2021-2026 ($ million)
Exhibit 29: Data Table on Injectables - Market size and forecast 2021-2026 ($ million)
Exhibit 30: Chart on Injectables - Year-over-year growth 2021-2026 (%)
Exhibit 31: Data Table on Injectables - Year-over-year growth 2021-2026 (%)
5.4 Topicals - Market size and forecast 2021-2026
Exhibit 32: Chart on Topicals - Market size and forecast 2021-2026 ($ million)
Exhibit 33: Data Table on Topicals - Market size and forecast 2021-2026 ($ million)
Exhibit 34: Chart on Topicals - Year-over-year growth 2021-2026 (%)
Exhibit 35: Data Table on Topicals - Year-over-year growth 2021-2026 (%)
5.5 Others - Market size and forecast 2021-2026
Exhibit 36: Chart on Others - Market size and forecast 2021-2026 ($ million)
Exhibit 37: Data Table on Others - Market size and forecast 2021-2026 ($ million)
Exhibit 38: Chart on Others - Year-over-year growth 2021-2026 (%)
Exhibit 39: Data Table on Others - Year-over-year growth 2021-2026 (%)
5.6 Market opportunity by Product
Exhibit 40: Market opportunity by Product ($ million)
6 Customer Landscape
6.1 Customer landscape overview
Exhibit 41: Analysis of price sensitivity, lifecycle, customer purchase basket, adoption rates, and purchase criteria
7 Geographic Landscape
7.1 Geographic segmentation
Exhibit 42: Chart on Market share by geography 2021-2026 (%)
Exhibit 43: Data Table on Market share by geography 2021-2026 (%)
7.2 Geographic comparison
Exhibit 44: Chart on Geographic comparison
Exhibit 45: Data Table on Geographic comparison
7.3 North America - Market size and forecast 2021-2026
Exhibit 46: Chart on North America - Market size and forecast 2021-2026 ($ million)
Exhibit 47: Data Table on North America - Market size and forecast 2021-2026 ($ million)
Exhibit 48: Chart on North America - Year-over-year growth 2021-2026 (%)
Exhibit 49: Data Table on North America - Year-over-year growth 2021-2026 (%)
7.4 Europe - Market size and forecast 2021-2026
Exhibit 50: Chart on Europe - Market size and forecast 2021-2026 ($ million)
Exhibit 51: Data Table on Europe - Market size and forecast 2021-2026 ($ million)
Exhibit 52: Chart on Europe - Year-over-year growth 2021-2026 (%)
Exhibit 53: Data Table on Europe - Year-over-year growth 2021-2026 (%)
7.5 Asia - Market size and forecast 2021-2026
Exhibit 54: Chart on Asia - Market size and forecast 2021-2026 ($ million)
Exhibit 55: Data Table on Asia - Market size and forecast 2021-2026 ($ million)
Exhibit 56: Chart on Asia - Year-over-year growth 2021-2026 (%)
Exhibit 57: Data Table on Asia - Year-over-year growth 2021-2026 (%)
7.6 Rest of World (ROW) - Market size and forecast 2021-2026
Exhibit 58: Chart on Rest of World (ROW) - Market size and forecast 2021-2026 ($ million)
Exhibit 59: Data Table on Rest of World (ROW) - Market size and forecast 2021-2026 ($ million)
Exhibit 60: Chart on Rest of World (ROW) - Year-over-year growth 2021-2026 (%)
Exhibit 61: Data Table on Rest of World (ROW) - Year-over-year growth 2021-2026 (%)
7.7 US - Market size and forecast 2021-2026
Exhibit 62: Chart on US - Market size and forecast 2021-2026 ($ million)
Exhibit 63: Data Table on US - Market size and forecast 2021-2026 ($ million)
Exhibit 64: Chart on US - Year-over-year growth 2021-2026 (%)
Exhibit 65: Data Table on US - Year-over-year growth 2021-2026 (%)
7.8 Canada - Market size and forecast 2021-2026
Exhibit 66: Chart on Canada - Market size and forecast 2021-2026 ($ million)
Exhibit 67: Data Table on Canada - Market size and forecast 2021-2026 ($ million)
Exhibit 68: Chart on Canada - Year-over-year growth 2021-2026 (%)
Exhibit 69: Data Table on Canada - Year-over-year growth 2021-2026 (%)
7.9 Germany - Market size and forecast 2021-2026
Exhibit 70: Chart on Germany - Market size and forecast 2021-2026 ($ million)
Exhibit 71: Data Table on Germany - Market size and forecast 2021-2026 ($ million)
Exhibit 72: Chart on Germany - Year-over-year growth 2021-2026 (%)
Exhibit 73: Data Table on Germany - Year-over-year growth 2021-2026 (%)
7.10 UK - Market size and forecast 2021-2026
Exhibit 74: Chart on UK - Market size and forecast 2021-2026 ($ million)
Exhibit 75: Data Table on UK - Market size and forecast 2021-2026 ($ million)
Exhibit 76: Chart on UK - Year-over-year growth 2021-2026 (%)
Exhibit 77: Data Table on UK - Year-over-year growth 2021-2026 (%)
7.11 China - Market size and forecast 2021-2026
Exhibit 78: Chart on China - Market size and forecast 2021-2026 ($ million)
Exhibit 79: Data Table on China - Market size and forecast 2021-2026 ($ million)
Exhibit 80: Chart on China - Year-over-year growth 2021-2026 (%)
Exhibit 81: Data Table on China - Year-over-year growth 2021-2026 (%)
7.12 Market opportunity by geography
Exhibit 82: Market opportunity by geography ($ million)
8 Drivers, Challenges, and Trends
8.1 Market drivers
8.2 Market challenges
8.3 Impact of drivers and challenges
Exhibit 83: Impact of drivers and challenges in 2021 and 2026
8.4 Market trends
9 Vendor Landscape
9.1 Overview
9.2 Vendor landscape
Exhibit 84: Overview on Criticality of inputs and Factors of differentiation
9.3 Landscape disruption
Exhibit 85: Overview on factors of disruption
9.4 Industry risks
Exhibit 86: Impact of key risks on business
10 Vendor Analysis
10.1 Vendors covered
Exhibit 87: Vendors covered
10.2 Market positioning of vendors
Exhibit 88: Matrix on vendor position and classification
10.3 AbbVie Inc.
Exhibit 89: AbbVie Inc. - Overview
Exhibit 90: AbbVie Inc. - Product / Service
Exhibit 91: AbbVie Inc. - Key offerings
10.4 Acerus Pharmaceuticals Corp.
Exhibit 92: Acerus Pharmaceuticals Corp. - Overview
Exhibit 93: Acerus Pharmaceuticals Corp. - Product / Service
Exhibit 94: Acerus Pharmaceuticals Corp. - Key offerings
10.5 Antares Pharma Inc.
Exhibit 95: Antares Pharma Inc. - Overview
Exhibit 96: Antares Pharma Inc. - Product / Service
Exhibit 97: Antares Pharma Inc. - Key news
Exhibit 98: Antares Pharma Inc. - Key offerings
10.6 Bayer AG
Exhibit 99: Bayer AG - Overview
Exhibit 100: Bayer AG - Business segments
Exhibit 101: Bayer AG - Key offerings
Exhibit 102: Bayer AG - Segment focus
10.7 Clarus Therapeutics Inc.
Exhibit 103: Clarus Therapeutics Inc. - Overview
Exhibit 104: Clarus Therapeutics Inc. - Product / Service
Exhibit 105: Clarus Therapeutics Inc. - Key offerings
10.8 Eli Lilly and Co.
Exhibit 106: Eli Lilly and Co. - Overview
Exhibit 107: Eli Lilly and Co. - Product / Service
Exhibit 108: Eli Lilly and Co. - Key offerings
10.9 Endo International Plc
Exhibit 109: Endo International Plc - Overview
Exhibit 110: Endo International Plc - Business segments
Exhibit 111: Endo International Plc - Key news
Exhibit 112: Endo International Plc - Key offerings
Exhibit 113: Endo International Plc - Segment focus
10.10 Novartis AG
Exhibit 114: Novartis AG - Overview
Exhibit 115: Novartis AG - Business segments
Exhibit 116: Novartis AG - Key offerings
Exhibit 117: Novartis AG - Segment focus
10.11 Pfizer Inc.
Exhibit 118: Pfizer Inc. - Overview
Exhibit 119: Pfizer Inc. - Product / Service
Exhibit 120: Pfizer Inc. - Key news
Exhibit 121: Pfizer Inc. - Key offerings
10.12 The Simple Pharma Co. UK Ltd.
Exhibit 122: The Simple Pharma Co. UK Ltd. - Overview
Exhibit 123: The Simple Pharma Co. UK Ltd. - Product / Service
Exhibit 124: The Simple Pharma Co. UK Ltd. - Key offerings
11 Appendix
11.1 Scope of the report
11.2 Inclusions and exclusions checklist
Exhibit 125: Inclusions checklist
Exhibit 126: Exclusions checklist
11.3 Currency conversion rates for US$
Exhibit 127: Currency conversion rates for US$
11.4 Research methodology
Exhibit 128: Research methodology
Exhibit 129: Validation techniques employed for market sizing
Exhibit 130: Information sources
11.5 List of abbreviations
Exhibit 131: List of abbreviations
About Us
Technavio is a leading global technology research and advisory company. Their research and analysis focus on emerging market trends and provide actionable insights to help businesses identify market opportunities and develop effective strategies to optimize their market positions. With over 500 specialized analysts, Technavio's report library consists of more than 17,000 reports and counting, covering 800 technologies, spanning across 50 countries. Their client base consists of enterprises of all sizes, including more than 100 Fortune 500 companies. This growing client base relies on Technavio's comprehensive coverage, extensive research, and actionable market insights to identify opportunities in existing and potential markets and assess their competitive positions within changing market scenarios.
Contact
Technavio Research
Jesse Maida
Media & Marketing Executive
US: +1 844 364 1100
UK: +44 203 893 3200
Email: [email protected]
Website:
SOURCE Technavio
仿制药
2021-03-12
New York, March 12, 2021 (GLOBE NEWSWIRE) -- Reportlinker.com announces the release of the report "Global Topical Drug Delivery Industry" -
In addition to being a global intelligence exchange platform, MarketGlass™ is a powerful knowledge center that delivers dynamic project-focused market intelligence. Client companies will have complete insider access to the project Data stack.
- Interactive peer-to-peer and enterprise-to-enterprise ideation and market intelligence exchange is facilitated via a robust, secure, and validated process. The process draws from uniquely qualified project-specific and geographically focused executives overseeing business development, marketing and sales operations.
Trends & Factors - Identifying and validating local trends and factors driving each competitive marketplace. These factors include pricing variances, market trajectories, Covid-19 impact and recovery, locally active leading brands, and other parameters impacting the region in the short to medium term such as supply chain realignments.
Identifying and validating local trends and factors driving each competitive marketplace. These factors include pricing variances, market trajectories, Covid-19 impact and recovery, locally active leading brands, and other parameters impacting the region in the short to medium term such as supply chain realignments. Mobile Access & App - Our mobile version of the report may be accessed via our mobile app or directly for a full mobile experience.
Our mobile version of the report may be accessed via our mobile app or directly for a full mobile experience. Complimentary Updates - for one year. At least one update in 12-month period is normal and anytime there’s a significant change affecting the market dynamics.
for one year. At least one update in 12-month period is normal and anytime there’s a significant change affecting the market dynamics. Bespoke Updates & Team Collaborations - Clients may build a bespoke version of our report with peers on our MarketGlass™ platform which enables multidimensional data simulations.
Clients may build a bespoke version of our report with peers on our MarketGlass™ platform which enables multidimensional data simulations. Knowledge Center - clients have full-stack data access for project data they support or purchase including primary research engagement stats, companies and executives.
Abstract:
- Global Topical Drug Delivery Market to Reach $129.9 Billion by 2027
- Amid the COVID-19 crisis, the global market for Topical Drug Delivery estimated at US$92.4 Billion in the year 2020, is projected to reach a revised size of US$129.9 Billion by 2027, growing at a CAGR of 5% over the analysis period 2020-2027. Semi-Solid Formulations, one of the segments analyzed in the report, is projected to record a 5.1% CAGR and reach US$51.1 Billion by the end of the analysis period. After an early analysis of the business implications of the pandemic and its induced economic crisis, growth in the Liquid Formulations segment is readjusted to a revised 4.6% CAGR for the next 7-year period.
- The U.S. Market is Estimated at $27.2 Billion, While China is Forecast to Grow at 4.7% CAGR
- The Topical Drug Delivery market in the U.S. is estimated at US$27.2 Billion in the year 2020. China, the world`s second largest economy, is forecast to reach a projected market size of US$22.9 Billion by the year 2027 trailing a CAGR of 4.7% over the analysis period 2020 to 2027. Among the other noteworthy geographic markets are Japan and Canada, each forecast to grow at 4.8% and 3.9% respectively over the 2020-2027 period. Within Europe, Germany is forecast to grow at approximately 4.1% CAGR.
- Solid Formulations Segment to Record 4.4% CAGR
- In the global Solid Formulations segment, USA, Canada, Japan, China and Europe will drive the 4.4% CAGR estimated for this segment. These regional markets accounting for a combined market size of US$14.1 Billion in the year 2020 will reach a projected size of US$19.1 Billion by the close of the analysis period. China will remain among the fastest growing in this cluster of regional markets. Led by countries such as Australia, India, and South Korea, the market in Asia-Pacific is forecast to reach US$14.9 Billion by the year 2027.
Select Competitors (Total 43 Featured) -
3M
Acrux Limited
Bayer AG
Biofarmitalia s.r.l
Cipla Inc.
Crescita Therapeutics Inc.
Galderma S.A.
GlaxoSmithKline plc
Janssen Global Services, LLC
Lohmann Therapie-Systeme AG
Medpharm
Mylan N.V.
Nitto Denko Corporation
Novartis AG
Pharmatek Laboratories, Inc.
Pocono Coated Products LLC
Skinvisible Pharmaceuticals, Inc.
Stiefel Laboratories, Inc.
Tapemark
Valeant Pharmaceuticals International, Inc.
West Pharmaceutical Services, Inc.
Read the full report:
I. METHODOLOGY
II. EXECUTIVE SUMMARY
1. MARKET OVERVIEW
Influencer Market Insights
World Market Trajectories
Impact of Covid-19 and a Looming Global Recession
Global Competitor Market Shares
Topical Drug Delivery Competitor Market Share Scenario
Worldwide (in %): 2020E
Global Competitor Market Shares by Segment
2. FOCUS ON SELECT PLAYERS
3. MARKET TRENDS & DRIVERS
4. GLOBAL MARKET PERSPECTIVE
Table 1: World Current & Future Analysis for Topical Drug
Delivery by Geographic Region - USA, Canada, Japan, China,
Europe, Asia-Pacific and Rest of World Markets - Independent
Analysis of Annual Sales in US$ Million for Years 2020 through
2027 and % CAGR
Table 2: World Historic Review for Topical Drug Delivery by
Geographic Region - USA, Canada, Japan, China, Europe,
Asia-Pacific and Rest of World Markets - Independent Analysis
of Annual Sales in US$ Million for Years 2012 through 2019 and
% CAGR
Table 3: World 15-Year Perspective for Topical Drug Delivery by
Geographic Region - Percentage Breakdown of Value Sales for
USA, Canada, Japan, China, Europe, Asia-Pacific and Rest of
World Markets for Years 2012, 2020 & 2027
Table 4: World Current & Future Analysis for Semi-Solid
Formulations by Geographic Region - USA, Canada, Japan, China,
Europe, Asia-Pacific and Rest of World Markets - Independent
Analysis of Annual Sales in US$ Million for Years 2020 through
2027 and % CAGR
Table 5: World Historic Review for Semi-Solid Formulations by
Geographic Region - USA, Canada, Japan, China, Europe,
Asia-Pacific and Rest of World Markets - Independent Analysis
of Annual Sales in US$ Million for Years 2012 through 2019 and
% CAGR
Table 6: World 15-Year Perspective for Semi-Solid Formulations
by Geographic Region - Percentage Breakdown of Value Sales for
USA, Canada, Japan, China, Europe, Asia-Pacific and Rest of
World for Years 2012, 2020 & 2027
Table 7: World Current & Future Analysis for Liquid
Formulations by Geographic Region - USA, Canada, Japan, China,
Europe, Asia-Pacific and Rest of World Markets - Independent
Analysis of Annual Sales in US$ Million for Years 2020 through
2027 and % CAGR
Table 8: World Historic Review for Liquid Formulations by
Geographic Region - USA, Canada, Japan, China, Europe,
Asia-Pacific and Rest of World Markets - Independent Analysis
of Annual Sales in US$ Million for Years 2012 through 2019 and
% CAGR
Table 9: World 15-Year Perspective for Liquid Formulations by
Geographic Region - Percentage Breakdown of Value Sales for
USA, Canada, Japan, China, Europe, Asia-Pacific and Rest of
World for Years 2012, 2020 & 2027
Table 10: World Current & Future Analysis for Solid
Formulations by Geographic Region - USA, Canada, Japan, China,
Europe, Asia-Pacific and Rest of World Markets - Independent
Analysis of Annual Sales in US$ Million for Years 2020 through
2027 and % CAGR
Table 11: World Historic Review for Solid Formulations by
Geographic Region - USA, Canada, Japan, China, Europe,
Asia-Pacific and Rest of World Markets - Independent Analysis
of Annual Sales in US$ Million for Years 2012 through 2019 and
% CAGR
Table 12: World 15-Year Perspective for Solid Formulations by
Geographic Region - Percentage Breakdown of Value Sales for
USA, Canada, Japan, China, Europe, Asia-Pacific and Rest of
World for Years 2012, 2020 & 2027
Table 13: World Current & Future Analysis for Transdermal
Products by Geographic Region - USA, Canada, Japan, China,
Europe, Asia-Pacific and Rest of World Markets - Independent
Analysis of Annual Sales in US$ Million for Years 2020 through
2027 and % CAGR
Table 14: World Historic Review for Transdermal Products by
Geographic Region - USA, Canada, Japan, China, Europe,
Asia-Pacific and Rest of World Markets - Independent Analysis
of Annual Sales in US$ Million for Years 2012 through 2019 and
% CAGR
Table 15: World 15-Year Perspective for Transdermal Products by
Geographic Region - Percentage Breakdown of Value Sales for
USA, Canada, Japan, China, Europe, Asia-Pacific and Rest of
World for Years 2012, 2020 & 2027
Table 16: World Current & Future Analysis for Home Care
Settings by Geographic Region - USA, Canada, Japan, China,
Europe, Asia-Pacific and Rest of World Markets - Independent
Analysis of Annual Sales in US$ Million for Years 2020 through
2027 and % CAGR
Table 17: World Historic Review for Home Care Settings by
Geographic Region - USA, Canada, Japan, China, Europe,
Asia-Pacific and Rest of World Markets - Independent Analysis
of Annual Sales in US$ Million for Years 2012 through 2019 and
% CAGR
Table 18: World 15-Year Perspective for Home Care Settings by
Geographic Region - Percentage Breakdown of Value Sales for
USA, Canada, Japan, China, Europe, Asia-Pacific and Rest of
World for Years 2012, 2020 & 2027
Table 19: World Current & Future Analysis for Hospitals &
Clinics by Geographic Region - USA, Canada, Japan, China,
Europe, Asia-Pacific and Rest of World Markets - Independent
Analysis of Annual Sales in US$ Million for Years 2020 through
2027 and % CAGR
Table 20: World Historic Review for Hospitals & Clinics by
Geographic Region - USA, Canada, Japan, China, Europe,
Asia-Pacific and Rest of World Markets - Independent Analysis
of Annual Sales in US$ Million for Years 2012 through 2019 and
% CAGR
Table 21: World 15-Year Perspective for Hospitals & Clinics by
Geographic Region - Percentage Breakdown of Value Sales for
USA, Canada, Japan, China, Europe, Asia-Pacific and Rest of
World for Years 2012, 2020 & 2027
Table 22: World Current & Future Analysis for Burn Centers by
Geographic Region - USA, Canada, Japan, China, Europe,
Asia-Pacific and Rest of World Markets - Independent Analysis
of Annual Sales in US$ Million for Years 2020 through 2027 and
% CAGR
Table 23: World Historic Review for Burn Centers by Geographic
Region - USA, Canada, Japan, China, Europe, Asia-Pacific and
Rest of World Markets - Independent Analysis of Annual Sales in
US$ Million for Years 2012 through 2019 and % CAGR
Table 24: World 15-Year Perspective for Burn Centers by
Geographic Region - Percentage Breakdown of Value Sales for
USA, Canada, Japan, China, Europe, Asia-Pacific and Rest of
World for Years 2012, 2020 & 2027
Table 25: World Current & Future Analysis for Other End-Uses by
Geographic Region - USA, Canada, Japan, China, Europe,
Asia-Pacific and Rest of World Markets - Independent Analysis
of Annual Sales in US$ Million for Years 2020 through 2027 and
% CAGR
Table 26: World Historic Review for Other End-Uses by
Geographic Region - USA, Canada, Japan, China, Europe,
Asia-Pacific and Rest of World Markets - Independent Analysis
of Annual Sales in US$ Million for Years 2012 through 2019 and
% CAGR
Table 27: World 15-Year Perspective for Other End-Uses by
Geographic Region - Percentage Breakdown of Value Sales for
USA, Canada, Japan, China, Europe, Asia-Pacific and Rest of
World for Years 2012, 2020 & 2027
Table 28: World Current & Future Analysis for Dermal Drug
Delivery by Geographic Region - USA, Canada, Japan, China,
Europe, Asia-Pacific and Rest of World Markets - Independent
Analysis of Annual Sales in US$ Million for Years 2020 through
2027 and % CAGR
Table 29: World Historic Review for Dermal Drug Delivery by
Geographic Region - USA, Canada, Japan, China, Europe,
Asia-Pacific and Rest of World Markets - Independent Analysis
of Annual Sales in US$ Million for Years 2012 through 2019 and
% CAGR
Table 30: World 15-Year Perspective for Dermal Drug Delivery by
Geographic Region - Percentage Breakdown of Value Sales for
USA, Canada, Japan, China, Europe, Asia-Pacific and Rest of
World for Years 2012, 2020 & 2027
Table 31: World Current & Future Analysis for Nasal Drug
Delivery by Geographic Region - USA, Canada, Japan, China,
Europe, Asia-Pacific and Rest of World Markets - Independent
Analysis of Annual Sales in US$ Million for Years 2020 through
2027 and % CAGR
Table 32: World Historic Review for Nasal Drug Delivery by
Geographic Region - USA, Canada, Japan, China, Europe,
Asia-Pacific and Rest of World Markets - Independent Analysis
of Annual Sales in US$ Million for Years 2012 through 2019 and
% CAGR
Table 33: World 15-Year Perspective for Nasal Drug Delivery by
Geographic Region - Percentage Breakdown of Value Sales for
USA, Canada, Japan, China, Europe, Asia-Pacific and Rest of
World for Years 2012, 2020 & 2027
Table 34: World Current & Future Analysis for Ophthalmic Drug
Delivery by Geographic Region - USA, Canada, Japan, China,
Europe, Asia-Pacific and Rest of World Markets - Independent
Analysis of Annual Sales in US$ Million for Years 2020 through
2027 and % CAGR
Table 35: World Historic Review for Ophthalmic Drug Delivery by
Geographic Region - USA, Canada, Japan, China, Europe,
Asia-Pacific and Rest of World Markets - Independent Analysis
of Annual Sales in US$ Million for Years 2012 through 2019 and
% CAGR
Table 36: World 15-Year Perspective for Ophthalmic Drug
Delivery by Geographic Region - Percentage Breakdown of Value
Sales for USA, Canada, Japan, China, Europe, Asia-Pacific and
Rest of World for Years 2012, 2020 & 2027
Table 37: World Current & Future Analysis for Rectal Drug
Delivery by Geographic Region - USA, Canada, Japan, China,
Europe, Asia-Pacific and Rest of World Markets - Independent
Analysis of Annual Sales in US$ Million for Years 2020 through
2027 and % CAGR
Table 38: World Historic Review for Rectal Drug Delivery by
Geographic Region - USA, Canada, Japan, China, Europe,
Asia-Pacific and Rest of World Markets - Independent Analysis
of Annual Sales in US$ Million for Years 2012 through 2019 and
% CAGR
Table 39: World 15-Year Perspective for Rectal Drug Delivery by
Geographic Region - Percentage Breakdown of Value Sales for
USA, Canada, Japan, China, Europe, Asia-Pacific and Rest of
World for Years 2012, 2020 & 2027
Table 40: World Current & Future Analysis for Vaginal Drug
Delivery by Geographic Region - USA, Canada, Japan, China,
Europe, Asia-Pacific and Rest of World Markets - Independent
Analysis of Annual Sales in US$ Million for Years 2020 through
2027 and % CAGR
Table 41: World Historic Review for Vaginal Drug Delivery by
Geographic Region - USA, Canada, Japan, China, Europe,
Asia-Pacific and Rest of World Markets - Independent Analysis
of Annual Sales in US$ Million for Years 2012 through 2019 and
% CAGR
Table 42: World 15-Year Perspective for Vaginal Drug Delivery
by Geographic Region - Percentage Breakdown of Value Sales for
USA, Canada, Japan, China, Europe, Asia-Pacific and Rest of
World for Years 2012, 2020 & 2027
III. MARKET ANALYSIS
UNITED STATES
Market Facts & Figures
Market Analytics
Table 43: USA Current & Future Analysis for Topical Drug
Delivery by Product - Semi-Solid Formulations, Liquid
Formulations, Solid Formulations and Transdermal Products -
Independent Analysis of Annual Sales in US$ Million for the
Years 2020 through 2027 and % CAGR
Table 44: USA Historic Review for Topical Drug Delivery by
Product - Semi-Solid Formulations, Liquid Formulations, Solid
Formulations and Transdermal Products Markets - Independent
Analysis of Annual Sales in US$ Million for Years 2012 through
2019 and % CAGR
Table 45: USA 15-Year Perspective for Topical Drug Delivery by
Product - Percentage Breakdown of Value Sales for Semi-Solid
Formulations, Liquid Formulations, Solid Formulations and
Transdermal Products for the Years 2012, 2020 & 2027
Table 46: USA Current & Future Analysis for Topical Drug
Delivery by End-Use - Home Care Settings, Hospitals & Clinics,
Burn Centers and Other End-Uses - Independent Analysis of
Annual Sales in US$ Million for the Years 2020 through 2027 and
% CAGR
Table 47: USA Historic Review for Topical Drug Delivery by
End-Use - Home Care Settings, Hospitals & Clinics, Burn Centers
and Other End-Uses Markets - Independent Analysis of Annual
Sales in US$ Million for Years 2012 through 2019 and % CAGR
Table 48: USA 15-Year Perspective for Topical Drug Delivery by
End-Use - Percentage Breakdown of Value Sales for Home Care
Settings, Hospitals & Clinics, Burn Centers and Other End-Uses
for the Years 2012, 2020 & 2027
Table 49: USA Current & Future Analysis for Topical Drug
Delivery by Route Of Administration - Dermal Drug Delivery,
Nasal Drug Delivery, Ophthalmic Drug Delivery, Rectal Drug
Delivery and Vaginal Drug Delivery - Independent Analysis of
Annual Sales in US$ Million for the Years 2020 through 2027 and
% CAGR
Table 50: USA Historic Review for Topical Drug Delivery by
Route Of Administration - Dermal Drug Delivery, Nasal Drug
Delivery, Ophthalmic Drug Delivery, Rectal Drug Delivery and
Vaginal Drug Delivery Markets - Independent Analysis of Annual
Sales in US$ Million for Years 2012 through 2019 and % CAGR
Table 51: USA 15-Year Perspective for Topical Drug Delivery by
Route Of Administration - Percentage Breakdown of Value Sales
for Dermal Drug Delivery, Nasal Drug Delivery, Ophthalmic Drug
Delivery, Rectal Drug Delivery and Vaginal Drug Delivery for
the Years 2012, 2020 & 2027
CANADA
Table 52: Canada Current & Future Analysis for Topical Drug
Delivery by Product - Semi-Solid Formulations, Liquid
Formulations, Solid Formulations and Transdermal Products -
Independent Analysis of Annual Sales in US$ Million for the
Years 2020 through 2027 and % CAGR
Table 53: Canada Historic Review for Topical Drug Delivery by
Product - Semi-Solid Formulations, Liquid Formulations, Solid
Formulations and Transdermal Products Markets - Independent
Analysis of Annual Sales in US$ Million for Years 2012 through
2019 and % CAGR
Table 54: Canada 15-Year Perspective for Topical Drug Delivery
by Product - Percentage Breakdown of Value Sales for Semi-Solid
Formulations, Liquid Formulations, Solid Formulations and
Transdermal Products for the Years 2012, 2020 & 2027
Table 55: Canada Current & Future Analysis for Topical Drug
Delivery by End-Use - Home Care Settings, Hospitals & Clinics,
Burn Centers and Other End-Uses - Independent Analysis of
Annual Sales in US$ Million for the Years 2020 through 2027 and
% CAGR
Table 56: Canada Historic Review for Topical Drug Delivery by
End-Use - Home Care Settings, Hospitals & Clinics, Burn Centers
and Other End-Uses Markets - Independent Analysis of Annual
Sales in US$ Million for Years 2012 through 2019 and % CAGR
Table 57: Canada 15-Year Perspective for Topical Drug Delivery
by End-Use - Percentage Breakdown of Value Sales for Home Care
Settings, Hospitals & Clinics, Burn Centers and Other End-Uses
for the Years 2012, 2020 & 2027
Table 58: Canada Current & Future Analysis for Topical Drug
Delivery by Route Of Administration - Dermal Drug Delivery,
Nasal Drug Delivery, Ophthalmic Drug Delivery, Rectal Drug
Delivery and Vaginal Drug Delivery - Independent Analysis of
Annual Sales in US$ Million for the Years 2020 through 2027 and
% CAGR
Table 59: Canada Historic Review for Topical Drug Delivery by
Route Of Administration - Dermal Drug Delivery, Nasal Drug
Delivery, Ophthalmic Drug Delivery, Rectal Drug Delivery and
Vaginal Drug Delivery Markets - Independent Analysis of Annual
Sales in US$ Million for Years 2012 through 2019 and % CAGR
Table 60: Canada 15-Year Perspective for Topical Drug Delivery
by Route Of Administration - Percentage Breakdown of Value
Sales for Dermal Drug Delivery, Nasal Drug Delivery, Ophthalmic
Drug Delivery, Rectal Drug Delivery and Vaginal Drug Delivery
for the Years 2012, 2020 & 2027
JAPAN
Table 61: Japan Current & Future Analysis for Topical Drug
Delivery by Product - Semi-Solid Formulations, Liquid
Formulations, Solid Formulations and Transdermal Products -
Independent Analysis of Annual Sales in US$ Million for the
Years 2020 through 2027 and % CAGR
Table 62: Japan Historic Review for Topical Drug Delivery by
Product - Semi-Solid Formulations, Liquid Formulations, Solid
Formulations and Transdermal Products Markets - Independent
Analysis of Annual Sales in US$ Million for Years 2012 through
2019 and % CAGR
Table 63: Japan 15-Year Perspective for Topical Drug Delivery
by Product - Percentage Breakdown of Value Sales for Semi-Solid
Formulations, Liquid Formulations, Solid Formulations and
Transdermal Products for the Years 2012, 2020 & 2027
Table 64: Japan Current & Future Analysis for Topical Drug
Delivery by End-Use - Home Care Settings, Hospitals & Clinics,
Burn Centers and Other End-Uses - Independent Analysis of
Annual Sales in US$ Million for the Years 2020 through 2027 and
% CAGR
Table 65: Japan Historic Review for Topical Drug Delivery by
End-Use - Home Care Settings, Hospitals & Clinics, Burn Centers
and Other End-Uses Markets - Independent Analysis of Annual
Sales in US$ Million for Years 2012 through 2019 and % CAGR
Table 66: Japan 15-Year Perspective for Topical Drug Delivery
by End-Use - Percentage Breakdown of Value Sales for Home Care
Settings, Hospitals & Clinics, Burn Centers and Other End-Uses
for the Years 2012, 2020 & 2027
Table 67: Japan Current & Future Analysis for Topical Drug
Delivery by Route Of Administration - Dermal Drug Delivery,
Nasal Drug Delivery, Ophthalmic Drug Delivery, Rectal Drug
Delivery and Vaginal Drug Delivery - Independent Analysis of
Annual Sales in US$ Million for the Years 2020 through 2027 and
% CAGR
Table 68: Japan Historic Review for Topical Drug Delivery by
Route Of Administration - Dermal Drug Delivery, Nasal Drug
Delivery, Ophthalmic Drug Delivery, Rectal Drug Delivery and
Vaginal Drug Delivery Markets - Independent Analysis of Annual
Sales in US$ Million for Years 2012 through 2019 and % CAGR
Table 69: Japan 15-Year Perspective for Topical Drug Delivery
by Route Of Administration - Percentage Breakdown of Value
Sales for Dermal Drug Delivery, Nasal Drug Delivery, Ophthalmic
Drug Delivery, Rectal Drug Delivery and Vaginal Drug Delivery
for the Years 2012, 2020 & 2027
CHINA
Table 70: China Current & Future Analysis for Topical Drug
Delivery by Product - Semi-Solid Formulations, Liquid
Formulations, Solid Formulations and Transdermal Products -
Independent Analysis of Annual Sales in US$ Million for the
Years 2020 through 2027 and % CAGR
Table 71: China Historic Review for Topical Drug Delivery by
Product - Semi-Solid Formulations, Liquid Formulations, Solid
Formulations and Transdermal Products Markets - Independent
Analysis of Annual Sales in US$ Million for Years 2012 through
2019 and % CAGR
Table 72: China 15-Year Perspective for Topical Drug Delivery
by Product - Percentage Breakdown of Value Sales for Semi-Solid
Formulations, Liquid Formulations, Solid Formulations and
Transdermal Products for the Years 2012, 2020 & 2027
Table 73: China Current & Future Analysis for Topical Drug
Delivery by End-Use - Home Care Settings, Hospitals & Clinics,
Burn Centers and Other End-Uses - Independent Analysis of
Annual Sales in US$ Million for the Years 2020 through 2027 and
% CAGR
Table 74: China Historic Review for Topical Drug Delivery by
End-Use - Home Care Settings, Hospitals & Clinics, Burn Centers
and Other End-Uses Markets - Independent Analysis of Annual
Sales in US$ Million for Years 2012 through 2019 and % CAGR
Table 75: China 15-Year Perspective for Topical Drug Delivery
by End-Use - Percentage Breakdown of Value Sales for Home Care
Settings, Hospitals & Clinics, Burn Centers and Other End-Uses
for the Years 2012, 2020 & 2027
Table 76: China Current & Future Analysis for Topical Drug
Delivery by Route Of Administration - Dermal Drug Delivery,
Nasal Drug Delivery, Ophthalmic Drug Delivery, Rectal Drug
Delivery and Vaginal Drug Delivery - Independent Analysis of
Annual Sales in US$ Million for the Years 2020 through 2027 and
% CAGR
Table 77: China Historic Review for Topical Drug Delivery by
Route Of Administration - Dermal Drug Delivery, Nasal Drug
Delivery, Ophthalmic Drug Delivery, Rectal Drug Delivery and
Vaginal Drug Delivery Markets - Independent Analysis of Annual
Sales in US$ Million for Years 2012 through 2019 and % CAGR
Table 78: China 15-Year Perspective for Topical Drug Delivery
by Route Of Administration - Percentage Breakdown of Value
Sales for Dermal Drug Delivery, Nasal Drug Delivery, Ophthalmic
Drug Delivery, Rectal Drug Delivery and Vaginal Drug Delivery
for the Years 2012, 2020 & 2027
EUROPE
Market Facts & Figures
Market Analytics
Table 79: Europe Current & Future Analysis for Topical Drug
Delivery by Geographic Region - France, Germany, Italy, UK and
Rest of Europe Markets - Independent Analysis of Annual Sales
in US$ Million for Years 2020 through 2027 and % CAGR
Table 80: Europe Historic Review for Topical Drug Delivery by
Geographic Region - France, Germany, Italy, UK and Rest of
Europe Markets - Independent Analysis of Annual Sales in US$
Million for Years 2012 through 2019 and % CAGR
Table 81: Europe 15-Year Perspective for Topical Drug Delivery
by Geographic Region - Percentage Breakdown of Value Sales for
France, Germany, Italy, UK and Rest of Europe Markets for Years
2012, 2020 & 2027
Table 82: Europe Current & Future Analysis for Topical Drug
Delivery by Product - Semi-Solid Formulations, Liquid
Formulations, Solid Formulations and Transdermal Products -
Independent Analysis of Annual Sales in US$ Million for the
Years 2020 through 2027 and % CAGR
Table 83: Europe Historic Review for Topical Drug Delivery by
Product - Semi-Solid Formulations, Liquid Formulations, Solid
Formulations and Transdermal Products Markets - Independent
Analysis of Annual Sales in US$ Million for Years 2012 through
2019 and % CAGR
Table 84: Europe 15-Year Perspective for Topical Drug Delivery
by Product - Percentage Breakdown of Value Sales for Semi-Solid
Formulations, Liquid Formulations, Solid Formulations and
Transdermal Products for the Years 2012, 2020 & 2027
Table 85: Europe Current & Future Analysis for Topical Drug
Delivery by End-Use - Home Care Settings, Hospitals & Clinics,
Burn Centers and Other End-Uses - Independent Analysis of
Annual Sales in US$ Million for the Years 2020 through 2027 and
% CAGR
Table 86: Europe Historic Review for Topical Drug Delivery by
End-Use - Home Care Settings, Hospitals & Clinics, Burn Centers
and Other End-Uses Markets - Independent Analysis of Annual
Sales in US$ Million for Years 2012 through 2019 and % CAGR
Table 87: Europe 15-Year Perspective for Topical Drug Delivery
by End-Use - Percentage Breakdown of Value Sales for Home Care
Settings, Hospitals & Clinics, Burn Centers and Other End-Uses
for the Years 2012, 2020 & 2027
Table 88: Europe Current & Future Analysis for Topical Drug
Delivery by Route Of Administration - Dermal Drug Delivery,
Nasal Drug Delivery, Ophthalmic Drug Delivery, Rectal Drug
Delivery and Vaginal Drug Delivery - Independent Analysis of
Annual Sales in US$ Million for the Years 2020 through 2027 and
% CAGR
Table 89: Europe Historic Review for Topical Drug Delivery by
Route Of Administration - Dermal Drug Delivery, Nasal Drug
Delivery, Ophthalmic Drug Delivery, Rectal Drug Delivery and
Vaginal Drug Delivery Markets - Independent Analysis of Annual
Sales in US$ Million for Years 2012 through 2019 and % CAGR
Table 90: Europe 15-Year Perspective for Topical Drug Delivery
by Route Of Administration - Percentage Breakdown of Value
Sales for Dermal Drug Delivery, Nasal Drug Delivery, Ophthalmic
Drug Delivery, Rectal Drug Delivery and Vaginal Drug Delivery
for the Years 2012, 2020 & 2027
FRANCE
Table 91: France Current & Future Analysis for Topical Drug
Delivery by Product - Semi-Solid Formulations, Liquid
Formulations, Solid Formulations and Transdermal Products -
Independent Analysis of Annual Sales in US$ Million for the
Years 2020 through 2027 and % CAGR
Table 92: France Historic Review for Topical Drug Delivery by
Product - Semi-Solid Formulations, Liquid Formulations, Solid
Formulations and Transdermal Products Markets - Independent
Analysis of Annual Sales in US$ Million for Years 2012 through
2019 and % CAGR
Table 93: France 15-Year Perspective for Topical Drug Delivery
by Product - Percentage Breakdown of Value Sales for Semi-Solid
Formulations, Liquid Formulations, Solid Formulations and
Transdermal Products for the Years 2012, 2020 & 2027
Table 94: France Current & Future Analysis for Topical Drug
Delivery by End-Use - Home Care Settings, Hospitals & Clinics,
Burn Centers and Other End-Uses - Independent Analysis of
Annual Sales in US$ Million for the Years 2020 through 2027 and
% CAGR
Table 95: France Historic Review for Topical Drug Delivery by
End-Use - Home Care Settings, Hospitals & Clinics, Burn Centers
and Other End-Uses Markets - Independent Analysis of Annual
Sales in US$ Million for Years 2012 through 2019 and % CAGR
Table 96: France 15-Year Perspective for Topical Drug Delivery
by End-Use - Percentage Breakdown of Value Sales for Home Care
Settings, Hospitals & Clinics, Burn Centers and Other End-Uses
for the Years 2012, 2020 & 2027
Table 97: France Current & Future Analysis for Topical Drug
Delivery by Route Of Administration - Dermal Drug Delivery,
Nasal Drug Delivery, Ophthalmic Drug Delivery, Rectal Drug
Delivery and Vaginal Drug Delivery - Independent Analysis of
Annual Sales in US$ Million for the Years 2020 through 2027 and
% CAGR
Table 98: France Historic Review for Topical Drug Delivery by
Route Of Administration - Dermal Drug Delivery, Nasal Drug
Delivery, Ophthalmic Drug Delivery, Rectal Drug Delivery and
Vaginal Drug Delivery Markets - Independent Analysis of Annual
Sales in US$ Million for Years 2012 through 2019 and % CAGR
Table 99: France 15-Year Perspective for Topical Drug Delivery
by Route Of Administration - Percentage Breakdown of Value
Sales for Dermal Drug Delivery, Nasal Drug Delivery, Ophthalmic
Drug Delivery, Rectal Drug Delivery and Vaginal Drug Delivery
for the Years 2012, 2020 & 2027
GERMANY
Table 100: Germany Current & Future Analysis for Topical Drug
Delivery by Product - Semi-Solid Formulations, Liquid
Formulations, Solid Formulations and Transdermal Products -
Independent Analysis of Annual Sales in US$ Million for the
Years 2020 through 2027 and % CAGR
Table 101: Germany Historic Review for Topical Drug Delivery by
Product - Semi-Solid Formulations, Liquid Formulations, Solid
Formulations and Transdermal Products Markets - Independent
Analysis of Annual Sales in US$ Million for Years 2012 through
2019 and % CAGR
Table 102: Germany 15-Year Perspective for Topical Drug
Delivery by Product - Percentage Breakdown of Value Sales for
Semi-Solid Formulations, Liquid Formulations, Solid
Formulations and Transdermal Products for the Years 2012, 2020 &
2027
Table 103: Germany Current & Future Analysis for Topical Drug
Delivery by End-Use - Home Care Settings, Hospitals & Clinics,
Burn Centers and Other End-Uses - Independent Analysis of
Annual Sales in US$ Million for the Years 2020 through 2027 and
% CAGR
Table 104: Germany Historic Review for Topical Drug Delivery by
End-Use - Home Care Settings, Hospitals & Clinics, Burn Centers
and Other End-Uses Markets - Independent Analysis of Annual
Sales in US$ Million for Years 2012 through 2019 and % CAGR
Table 105: Germany 15-Year Perspective for Topical Drug
Delivery by End-Use - Percentage Breakdown of Value Sales for
Home Care Settings, Hospitals & Clinics, Burn Centers and Other
End-Uses for the Years 2012, 2020 & 2027
Table 106: Germany Current & Future Analysis for Topical Drug
Delivery by Route Of Administration - Dermal Drug Delivery,
Nasal Drug Delivery, Ophthalmic Drug Delivery, Rectal Drug
Delivery and Vaginal Drug Delivery - Independent Analysis of
Annual Sales in US$ Million for the Years 2020 through 2027 and
% CAGR
Table 107: Germany Historic Review for Topical Drug Delivery by
Route Of Administration - Dermal Drug Delivery, Nasal Drug
Delivery, Ophthalmic Drug Delivery, Rectal Drug Delivery and
Vaginal Drug Delivery Markets - Independent Analysis of Annual
Sales in US$ Million for Years 2012 through 2019 and % CAGR
Table 108: Germany 15-Year Perspective for Topical Drug
Delivery by Route Of Administration - Percentage Breakdown of
Value Sales for Dermal Drug Delivery, Nasal Drug Delivery,
Ophthalmic Drug Delivery, Rectal Drug Delivery and Vaginal Drug
Delivery for the Years 2012, 2020 & 2027
ITALY
Table 109: Italy Current & Future Analysis for Topical Drug
Delivery by Product - Semi-Solid Formulations, Liquid
Formulations, Solid Formulations and Transdermal Products -
Independent Analysis of Annual Sales in US$ Million for the
Years 2020 through 2027 and % CAGR
Table 110: Italy Historic Review for Topical Drug Delivery by
Product - Semi-Solid Formulations, Liquid Formulations, Solid
Formulations and Transdermal Products Markets - Independent
Analysis of Annual Sales in US$ Million for Years 2012 through
2019 and % CAGR
Table 111: Italy 15-Year Perspective for Topical Drug Delivery
by Product - Percentage Breakdown of Value Sales for Semi-Solid
Formulations, Liquid Formulations, Solid Formulations and
Transdermal Products for the Years 2012, 2020 & 2027
Table 112: Italy Current & Future Analysis for Topical Drug
Delivery by End-Use - Home Care Settings, Hospitals & Clinics,
Burn Centers and Other End-Uses - Independent Analysis of
Annual Sales in US$ Million for the Years 2020 through 2027 and
% CAGR
Table 113: Italy Historic Review for Topical Drug Delivery by
End-Use - Home Care Settings, Hospitals & Clinics, Burn Centers
and Other End-Uses Markets - Independent Analysis of Annual
Sales in US$ Million for Years 2012 through 2019 and % CAGR
Table 114: Italy 15-Year Perspective for Topical Drug Delivery
by End-Use - Percentage Breakdown of Value Sales for Home Care
Settings, Hospitals & Clinics, Burn Centers and Other End-Uses
for the Years 2012, 2020 & 2027
Table 115: Italy Current & Future Analysis for Topical Drug
Delivery by Route Of Administration - Dermal Drug Delivery,
Nasal Drug Delivery, Ophthalmic Drug Delivery, Rectal Drug
Delivery and Vaginal Drug Delivery - Independent Analysis of
Annual Sales in US$ Million for the Years 2020 through 2027 and
% CAGR
Table 116: Italy Historic Review for Topical Drug Delivery by
Route Of Administration - Dermal Drug Delivery, Nasal Drug
Delivery, Ophthalmic Drug Delivery, Rectal Drug Delivery and
Vaginal Drug Delivery Markets - Independent Analysis of Annual
Sales in US$ Million for Years 2012 through 2019 and % CAGR
Table 117: Italy 15-Year Perspective for Topical Drug Delivery
by Route Of Administration - Percentage Breakdown of Value
Sales for Dermal Drug Delivery, Nasal Drug Delivery, Ophthalmic
Drug Delivery, Rectal Drug Delivery and Vaginal Drug Delivery
for the Years 2012, 2020 & 2027
UNITED KINGDOM
Table 118: UK Current & Future Analysis for Topical Drug
Delivery by Product - Semi-Solid Formulations, Liquid
Formulations, Solid Formulations and Transdermal Products -
Independent Analysis of Annual Sales in US$ Million for the
Years 2020 through 2027 and % CAGR
Table 119: UK Historic Review for Topical Drug Delivery by
Product - Semi-Solid Formulations, Liquid Formulations, Solid
Formulations and Transdermal Products Markets - Independent
Analysis of Annual Sales in US$ Million for Years 2012 through
2019 and % CAGR
Table 120: UK 15-Year Perspective for Topical Drug Delivery by
Product - Percentage Breakdown of Value Sales for Semi-Solid
Formulations, Liquid Formulations, Solid Formulations and
Transdermal Products for the Years 2012, 2020 & 2027
Table 121: UK Current & Future Analysis for Topical Drug
Delivery by End-Use - Home Care Settings, Hospitals & Clinics,
Burn Centers and Other End-Uses - Independent Analysis of
Annual Sales in US$ Million for the Years 2020 through 2027 and
% CAGR
Table 122: UK Historic Review for Topical Drug Delivery by
Please contact our Customer Support Center to get the complete Table of Contents
Read the full report:
About Reportlinker
ReportLinker is an award-winning market research solution. Reportlinker finds and organizes the latest industry data so you get all the market research you need - instantly, in one place.
__________________________
Clare: clare@reportlinker.com US: (339)-368-6001 Intl: +1 339-368-6001
合作
100 项与 Acrux Ltd. 相关的药物交易
登录后查看更多信息
100 项与 Acrux Ltd. 相关的转化医学
登录后查看更多信息
组织架构
使用我们的机构树数据加速您的研究。
登录
或
管线布局
2025年06月11日管线快照
管线布局中药物为当前组织机构及其子机构作为药物机构进行统计,早期临床1期并入临床1期,临床1/2期并入临床2期,临床2/3期并入临床3期
临床前
1
3
其他
登录后查看更多信息
药物交易
使用我们的药物交易数据加速您的研究。
登录
或
转化医学
使用我们的转化医学数据加速您的研究。
登录
或
营收
使用 Synapse 探索超过 36 万个组织的财务状况。
登录
或
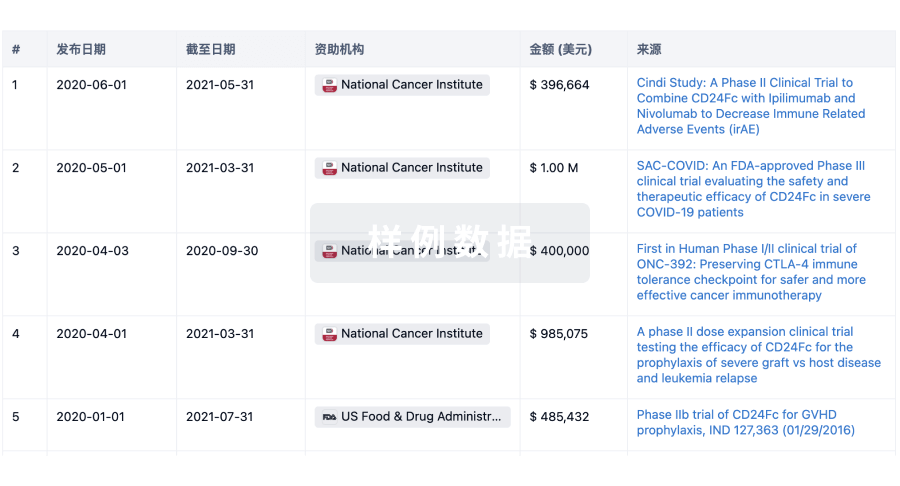
科研基金(NIH)
访问超过 200 万项资助和基金信息,以提升您的研究之旅。
登录
或
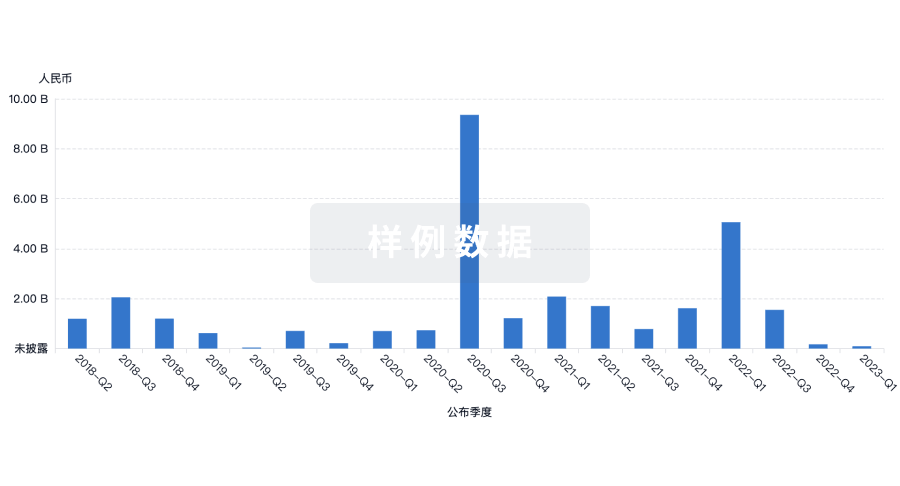
投资
深入了解从初创企业到成熟企业的最新公司投资动态。
登录
或
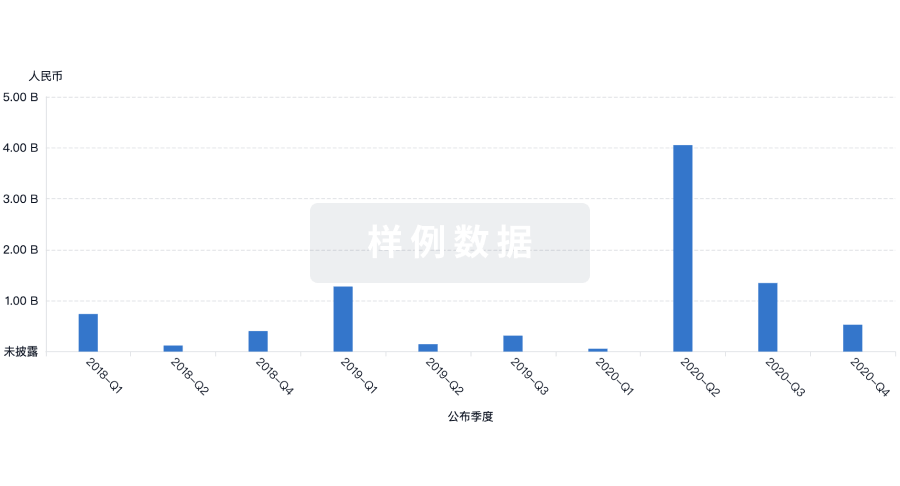
融资
发掘融资趋势以验证和推进您的投资机会。
登录
或
Eureka LS:
全新生物医药AI Agent 覆盖科研全链路,让突破性发现快人一步
立即开始免费试用!
智慧芽新药情报库是智慧芽专为生命科学人士构建的基于AI的创新药情报平台,助您全方位提升您的研发与决策效率。
立即开始数据试用!
智慧芽新药库数据也通过智慧芽数据服务平台,以API或者数据包形式对外开放,助您更加充分利用智慧芽新药情报信息。
生物序列数据库
生物药研发创新
免费使用
化学结构数据库
小分子化药研发创新
免费使用