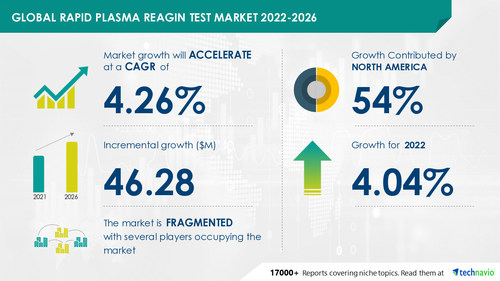
Rapid Plasma Reagin Test Market to observe USD 46.28 Mn incremental growth -- Driven by increasing incidence of syphilis
2022-09-21
NEW YORK, Sept. 20, 2022 /PRNewswire/ -- The "
Rapid Plasma Reagin Test Market by Test and Geography - Forecast and Analysis 2022-2026" report has been added to Technavio's offering. The report expects the market size to grow by USD 46.28 million, accelerating at a CAGR of 4.26 between 2021 and 2026. The report considers various aspects such as the consumer base, adoption rate, average selling price, revenue generated by vendors, and various other factors to estimate the market size.
Download Sample PDF Report Here to get an idea of the overall scope of the full report.
Continue Reading
Preview
来源: PRNewswire
Technavio has announced its latest market research report titled Global Rapid Plasma Reagin Test Market 2022-2026
The global rapid plasma reagin test market is fragmented due to the presence of several prominent vendors. The established vendors have a sizeable market presence. They are continuously innovating their product offerings, which is enabling them to compete with larger players more effectively, intensifying competition in the market. The increasing regulatory standards and high capital requirements associated with RPR tests are reducing the entry of new players into the market.
The report considers Abbott Laboratories, Anamol Laboratories Pvt. Ltd., ARKRAY Inc., Arlington Scientific Inc., Atlas Medical GmbH, Becton Dickinson and Co., Bio Rad Laboratories Inc., Cardinal Health Inc., F. Hoffmann La Roche Ltd., Innovatek Medical Inc., Lorne Laboratories Ltd., Mediclone Biotech, Newmarket Biomedical Ltd., Novacyt SA, Sclavo Diagnostics International S.r.l., Sekisui Chemical Co. Ltd., and Thermo Fisher Scientific Inc. as major market participants. Although the increasing incidence of syphilis will offer immense growth opportunities, ensuring quality control for syphilis testing will challenge the growth of the market participants. To make the most of the opportunities, market vendors should focus more on the growth prospects in the fast-growing segments, while maintaining their positions in the slow-growing segments.
Request Sample Report Here
The global rapid plasma reagin test market is segmented as below:
Type
Rapid Plasma Reagin Test Kits
Analyzers and Instruments
Reagents
The market growth in the rapid plasma regain test kits segment will be significant during the forecast period. The segment is driven by the growing availability of RPR test kits and the high use of assays.
Geography
North America
Europe
Asia
Rest Of World (ROW)
North America is the largest market for rigid plasma reagin, occupying 54% of the global market share. The regional market is driven by the presence of a large number of vendors that offer RPR test kits, analyzers and instruments, and reagents. Technavio presents a detailed picture of the market by way of study, synthesis, and summation of data from multiple sources. Our rapid plasma reagin test market report covers the following areas:
Rapid Plasma Reagin Test Market Size
Rapid Plasma Reagin Test Market Trends
Rapid Plasma Reagin Test Market Industry Analysis
Rapid Plasma Reagin Test Market 2022-2026: Vendor Analysis
We provide a detailed analysis of around 25 vendors operating in the rapid plasma reagin test market. Backed with competitive intelligence and benchmarking, our research report on the rapid plasma reagin test market is designed to provide entry support, customer profile, and M&As as well as go-to-market strategy support.
Rapid Plasma Reagin Test Market 2022-2026: Key Highlights
CAGR of the market during the forecast period 2022-2026
Detailed information on factors that will assist rapid plasma reagin test market growth during the next five years
Estimation of the rapid plasma reagin test market size and its contribution to the parent market
Predictions on upcoming trends and changes in consumer behavior
The growth of the rapid plasma reagin test market
Analysis of the market's competitive landscape and detailed information on vendors
Comprehensive details of factors that will challenge the growth of rapid plasma reagin test market vendors
Related Reports:
Plasma Therapeutics Market by Product and Geography - Forecast and Analysis 2022-2026
Plasma Protease C1 Inhibitor Market by Product and Geography - Forecast and Analysis 2022-2026
Table Of Contents:
1 Executive Summary
1.1 Market overview
Exhibit 01: Executive Summary – Chart on Market Overview
Exhibit 02: Executive Summary – Data Table on Market Overview
Exhibit 03: Executive Summary – Chart on Global Market Characteristics
Exhibit 04: Executive Summary – Chart on Market by Geography
Exhibit 05: Executive Summary – Chart on Market Segmentation by Test
Exhibit 06: Executive Summary – Chart on Incremental Growth
Exhibit 07: Executive Summary – Data Table on Incremental Growth
Exhibit 08: Executive Summary – Chart on Vendor Market Positioning
2 Market Landscape
2.1 Market ecosystem
Exhibit 09: Parent market
Exhibit 10: Market Characteristics
3 Market Sizing
3.1 Market definition
Exhibit 11: Offerings of vendors included in the market definition
3.2 Market segment analysis
Exhibit 12: Market segments
3.3 Market size 2021
3.4 Market outlook: Forecast for 2021-2026
Exhibit 13: Chart on Global - Market size and forecast 2021-2026 ($ million)
Exhibit 14: Data Table on Global - Market size and forecast 2021-2026 ($ million)
Exhibit 15: Chart on Global Market: Year-over-year growth 2021-2026 (%)
Exhibit 16: Data Table on Global Market: Year-over-year growth 2021-2026 (%)
4 Five Forces Analysis
4.1 Five forces summary
Exhibit 17: Five forces analysis - Comparison between2021 and 2026
4.2 Bargaining power of buyers
Exhibit 18: Chart on Bargaining power of buyers – Impact of key factors 2021 and 2026
4.3 Bargaining power of suppliers
Exhibit 19: Bargaining power of suppliers – Impact of key factors in 2021 and 2026
4.4 Threat of new entrants
Exhibit 20: Threat of new entrants – Impact of key factors in 2021 and 2026
4.5 Threat of substitutes
Exhibit 21: Threat of substitutes – Impact of key factors in 2021 and 2026
4.6 Threat of rivalry
Exhibit 22: Threat of rivalry – Impact of key factors in 2021 and 2026
4.7 Market condition
Exhibit 23: Chart on Market condition - Five forces 2021 and 2026
5 Market Segmentation by Test
5.1 Market segments
Exhibit 24: Chart on Test - Market share 2021-2026 (%)
Exhibit 25: Data Table on Test - Market share 2021-2026 (%)
5.2 Comparison by Test
Exhibit 26: Chart on Comparison by Test
Exhibit 27: Data Table on Comparison by Test
5.3 Rapid plasma reagin test kits - Market size and forecast 2021-2026
Exhibit 28: Chart on Rapid plasma reagin test kits - Market size and forecast 2021-2026 ($ million)
Exhibit 29: Data Table on Rapid plasma reagin test kits - Market size and forecast 2021-2026 ($ million)
Exhibit 30: Chart on Rapid plasma reagin test kits - Year-over-year growth 2021-2026 (%)
Exhibit 31: Data Table on Rapid plasma reagin test kits - Year-over-year growth 2021-2026 (%)
5.4 Analyzers and instruments - Market size and forecast 2021-2026
Exhibit 32: Chart on Analyzers and instruments - Market size and forecast 2021-2026 ($ million)
Exhibit 33: Data Table on Analyzers and instruments - Market size and forecast 2021-2026 ($ million)
Exhibit 34: Chart on Analyzers and instruments - Year-over-year growth 2021-2026 (%)
Exhibit 35: Data Table on Analyzers and instruments - Year-over-year growth 2021-2026 (%)
5.5 Reagents - Market size and forecast 2021-2026
Exhibit 36: Chart on Reagents - Market size and forecast 2021-2026 ($ million)
Exhibit 37: Data Table on Reagents - Market size and forecast 2021-2026 ($ million)
Exhibit 38: Chart on Reagents - Year-over-year growth 2021-2026 (%)
Exhibit 39: Data Table on Reagents - Year-over-year growth 2021-2026 (%)
5.6 Market opportunity by Test
Exhibit 40: Market opportunity by Test ($ million)
6 Customer Landscape
6.1 Customer landscape overview
Exhibit 41: Analysis of price sensitivity, lifecycle, customer purchase basket, adoption rates, and purchase criteria
7 Geographic Landscape
7.1 Geographic segmentation
Exhibit 42: Chart on Market share by geography 2021-2026 (%)
Exhibit 43: Data Table on Market share by geography 2021-2026 (%)
7.2 Geographic comparison
Exhibit 44: Chart on Geographic comparison
Exhibit 45: Data Table on Geographic comparison
7.3 North America - Market size and forecast 2021-2026
Exhibit 46: Chart on North America - Market size and forecast 2021-2026 ($ million)
Exhibit 47: Data Table on North America - Market size and forecast 2021-2026 ($ million)
Exhibit 48: Chart on North America - Year-over-year growth 2021-2026 (%)
Exhibit 49: Data Table on North America - Year-over-year growth 2021-2026 (%)
7.4 Europe - Market size and forecast 2021-2026
Exhibit 50: Chart on Europe - Market size and forecast 2021-2026 ($ million)
Exhibit 51: Data Table on Europe - Market size and forecast 2021-2026 ($ million)
Exhibit 52: Chart on Europe - Year-over-year growth 2021-2026 (%)
Exhibit 53: Data Table on Europe - Year-over-year growth 2021-2026 (%)
7.5 Asia - Market size and forecast 2021-2026
Exhibit 54: Chart on Asia - Market size and forecast 2021-2026 ($ million)
Exhibit 55: Data Table on Asia - Market size and forecast 2021-2026 ($ million)
Exhibit 56: Chart on Asia - Year-over-year growth 2021-2026 (%)
Exhibit 57: Data Table on Asia - Year-over-year growth 2021-2026 (%)
7.6 Rest of World (ROW) - Market size and forecast 2021-2026
Exhibit 58: Chart on Rest of World (ROW) - Market size and forecast 2021-2026 ($ million)
Exhibit 59: Data Table on Rest of World (ROW) - Market size and forecast 2021-2026 ($ million)
Exhibit 60: Chart on Rest of World (ROW) - Year-over-year growth 2021-2026 (%)
Exhibit 61: Data Table on Rest of World (ROW) - Year-over-year growth 2021-2026 (%)
7.7 US - Market size and forecast 2021-2026
Exhibit 62: Chart on US - Market size and forecast 2021-2026 ($ million)
Exhibit 63: Data Table on US - Market size and forecast 2021-2026 ($ million)
Exhibit 64: Chart on US - Year-over-year growth 2021-2026 (%)
Exhibit 65: Data Table on US - Year-over-year growth 2021-2026 (%)
7.8 France - Market size and forecast 2021-2026
Exhibit 66: Chart on France - Market size and forecast 2021-2026 ($ million)
Exhibit 67: Data Table on France - Market size and forecast 2021-2026 ($ million)
Exhibit 68: Chart on France - Year-over-year growth 2021-2026 (%)
Exhibit 69: Data Table on France - Year-over-year growth 2021-2026 (%)
7.9 China - Market size and forecast 2021-2026
Exhibit 70: Chart on China - Market size and forecast 2021-2026 ($ million)
Exhibit 71: Data Table on China - Market size and forecast 2021-2026 ($ million)
Exhibit 72: Chart on China - Year-over-year growth 2021-2026 (%)
Exhibit 73: Data Table on China - Year-over-year growth 2021-2026 (%)
7.10 Canada - Market size and forecast 2021-2026
Exhibit 74: Chart on Canada - Market size and forecast 2021-2026 ($ million)
Exhibit 75: Data Table on Canada - Market size and forecast 2021-2026 ($ million)
Exhibit 76: Chart on Canada - Year-over-year growth 2021-2026 (%)
Exhibit 77: Data Table on Canada - Year-over-year growth 2021-2026 (%)
7.11 Germany - Market size and forecast 2021-2026
Exhibit 78: Chart on Germany - Market size and forecast 2021-2026 ($ million)
Exhibit 79: Data Table on Germany - Market size and forecast 2021-2026 ($ million)
Exhibit 80: Chart on Germany - Year-over-year growth 2021-2026 (%)
Exhibit 81: Data Table on Germany - Year-over-year growth 2021-2026 (%)
7.12 Market opportunity by geography
Exhibit 82: Market opportunity by geography ($ million)
8 Drivers, Challenges, and Trends
8.1 Market drivers
8.2 Market challenges
8.3 Impact of drivers and challenges
Exhibit 83: Impact of drivers and challenges in 2021 and 2026
8.4 Market trends
9 Vendor Landscape
9.1 Overview
9.2 Vendor landscape
Exhibit 84: Overview on Criticality of inputs and Factors of differentiation
9.3 Landscape disruption
Exhibit 85: Overview on factors of disruption
9.4 Industry risks
Exhibit 86: Impact of key risks on business
10 Vendor Analysis
10.1 Vendors covered
Exhibit 87: Vendors covered
10.2 Market positioning of vendors
Exhibit 88: Matrix on vendor position and classification
10.3 Abbott Laboratories
Exhibit 89: Abbott Laboratories - Overview
Exhibit 90: Abbott Laboratories - Business segments
Exhibit 91: Abbott Laboratories - Key news
Exhibit 92: Abbott Laboratories - Key offerings
Exhibit 93: Abbott Laboratories - Segment focus
Exhibit 94: Arlington Scientific Inc. - Overview
Exhibit 95: Arlington Scientific Inc. - Product / Service
Exhibit 96: Arlington Scientific Inc. - Key offerings
10.5 Becton Dickinson and Co.
Exhibit 97: Becton Dickinson and Co. - Overview
Exhibit 98: Becton Dickinson and Co. - Business segments
Exhibit 99: Becton Dickinson and Co. - Key news
Exhibit 100: Becton Dickinson and Co. - Key offerings
Exhibit 101: Becton Dickinson and Co. - Segment focus
10.6 Bio Rad Laboratories Inc.
Exhibit 102: Bio Rad Laboratories Inc. - Overview
Exhibit 103: Bio Rad Laboratories Inc. - Business segments
Exhibit 104: Bio Rad Laboratories Inc. - Key news
Exhibit 105: Bio Rad Laboratories Inc. - Key offerings
Exhibit 106: Bio Rad Laboratories Inc. - Segment focus
10.7 Cardinal Health Inc.
Exhibit 107: Cardinal Health Inc. - Overview
Exhibit 108: Cardinal Health Inc. - Business segments
Exhibit 109: Cardinal Health Inc. - Key news
Exhibit 110: Cardinal Health Inc. - Key offerings
Exhibit 111: Cardinal Health Inc. - Segment focus
10.8 F. Hoffmann La Roche Ltd.
Exhibit 112: F. Hoffmann La Roche Ltd. - Overview
Exhibit 113: F. Hoffmann La Roche Ltd. - Business segments
Exhibit 114: F. Hoffmann La Roche Ltd. - Key news
Exhibit 115: F. Hoffmann La Roche Ltd. - Key offerings
Exhibit 116: F. Hoffmann La Roche Ltd. - Segment focus
10.9 Novacyt SA
Exhibit 117: Novacyt SA - Overview
Exhibit 118: Novacyt SA - Business segments
Exhibit 119: Novacyt SA - Key offerings
Exhibit 120: Novacyt SA - Segment focus
10.10 Sclavo Diagnostics International S.r.l.
Exhibit 121: Sclavo Diagnostics International S.r.l. - Overview
Exhibit 122: Sclavo Diagnostics International S.r.l. - Product / Service
Exhibit 123: Sclavo Diagnostics International S.r.l. - Key offerings
10.11 Sekisui Chemical Co. Ltd.
Exhibit 124: Sekisui Chemical Co. Ltd. - Overview
Exhibit 125: Sekisui Chemical Co. Ltd. - Business segments
Exhibit 126: Sekisui Chemical Co. Ltd. - Key offerings
Exhibit 127: Sekisui Chemical Co. Ltd. - Segment focus
Exhibit 128: Thermo Fisher Scientific Inc. - Overview
Exhibit 129: Thermo Fisher Scientific Inc. - Business segments
Exhibit 130: Thermo Fisher Scientific Inc. - Key news
Exhibit 131: Thermo Fisher Scientific Inc. - Key offerings
Exhibit 132: Thermo Fisher Scientific Inc. - Segment focus
11.1 Scope of the report
11.2 Inclusions and exclusions checklist
Exhibit 133: Inclusions checklist
Exhibit 134: Exclusions checklist
11.3 Currency conversion rates for US$
Exhibit 135: Currency conversion rates for US$
11.4 Research methodology
Exhibit 136: Research methodology
Exhibit 137: Validation techniques employed for market sizing
Exhibit 138: Information sources
11.5 List of abbreviations
Exhibit 139: List of abbreviations
About Us
Technavio is a leading global technology research and advisory company. Their research and analysis focus on emerging market trends and provides actionable insights to help businesses identify market opportunities and develop effective strategies to optimize their market positions. With over 500 specialized analysts, Technavio's report library consists of more than 17,000 reports and counting, covering 800 technologies, spanning across 50 countries. Their client base consists of enterprises of all sizes, including more than 100 Fortune 500 companies. This growing client base relies on Technavio's comprehensive coverage, extensive research, and actionable market insights to identify opportunities in existing and potential markets and assess their competitive positions within changing market scenarios.
Contact
Technavio Research
Jesse Maida
US: +1 844 364 1100
UK: +44 203 893 3200
Email: [email protected]
Website: www.technavio.com/
SOURCE Technavio
更多内容,请访问原始网站
文中所述内容并不反映新药情报库及其所属公司任何意见及观点,如有版权侵扰或错误之处,请及时联系我们,我们会在24小时内配合处理。


适应症
靶点
-来和芽仔聊天吧


立即开始免费试用!
智慧芽新药情报库是智慧芽专为生命科学人士构建的基于AI的创新药情报平台,助您全方位提升您的研发与决策效率。
立即开始数据试用!
智慧芽新药库数据也通过智慧芽数据服务平台,以API或者数据包形式对外开放,助您更加充分利用智慧芽新药情报信息。