Global Peptide Therapeutics Market to Grow by USD 23.36 Bn, Collaboration for research and development to be the Key Trend - Technavio
2022-11-02
合作
NEW YORK, Nov. 2, 2022 /PRNewswire/ -- Collaboration for research and development is one of the key peptide therapeutics market trends that is expected to impact the industry positively in the forecast period. Companies are entering into strategic alliances to overcome technological and research challenges. For instance, AstraZeneca entered into a collaboration agreement with Bicycle Therapeutics for the development of novel peptide-based therapies using Bicycles. The pharmaceutical companies such as Novo Nordisk, Zealand Pharma, and Zydus Cadila sponsor various research programs with the Peptide Therapeutics Foundation, a not-for-profit organization focusing on the development of peptides for the treatment of various indications, which will further support the market growth in the coming years.
Continue Reading
Preview
来源: PRNewswire
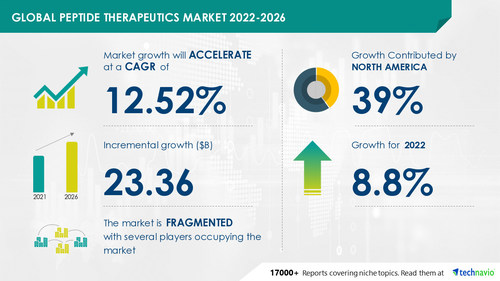
Technavio has announced its latest market research report titled Global Peptide Therapeutics Market 2022-2026
The
peptide therapeutics market size is expected to grow by USD 23.36 billion from 2021 to 2026. In addition, the growth momentum of the market will accelerate at a CAGR of 12.52% during the forecast period, according to Technavio. The increasing prevalence of infectious diseases are driving the peptide therapeutics market growth. However, factors such as Stringent regulatory policies may challenge the market growth.
Get a comprehensive report summary that describes the market size and forecast along with research methodology. The
FREE sample report
is available in PDF format
Peptide Therapeutics Market: Product Landscape
By route of administration, the parenteral segment will be the largest contributor to market growth during the forecast period. Most of the major peptide drugs that are currently approved in the market are administered through the parenteral route. The popularity of parenteral RoA for peptide therapeutics is largely due to the rapid absorption of drugs and, thereby, the avoidance of drug loss through first-pass metabolism. Such factors will drive segment growth in the coming years.
Subscribe to our
"Basic Plan" billed annually at USD 5000
that enables you to download 5 reports and view 100 reports per month
Peptide Therapeutics Market: Geography Landscape
By geography, the market has been segmented into North America, Europe, APAC, and Rest of World (ROW).
North America is going to have lucrative growth during the forecast period. About 39% of the market's overall growth is expected to originate from the region. US, Canada, and Mexico are the key markets for knee replacement in North America. Market growth in this region will be faster than the growth of the market in Rest of World (ROW).
Learn about the contribution of each segment summarized in concise infographics and thorough descriptions.
View a FREE PDF Sample Report
Peptide Therapeutics Market: Key Companies and their Offerings
Amgen Inc. - The unified segment focuses on discovering, developing, manufacturing, and delivering innovative human therapeutics.
Almac Group Ltd.- The company offers automotive projector headlamps that provide ability to increase safety and functionality, but it also affords customers the opportunity to differentiate their vehicles with lighting design and create customizable driving experiences that can evoke a sense of well-being for the driver.
AmbioPharm Inc. - The company offers automotive projector headlamps that help to make driving comfortable and safe.
Bristol Myers Squibb Co. - The company offers automotive projector headlamps that allow the driver to travel in his vehicle with a permanent high beam without the risk of dazzling other vehicles.
This report provides a full list of key vendors, their strategies, and the latest developments.
Buy Now
for detailed vendor information.
What our reports offer:
Market share assessments for the regional and country-level segments
Strategic recommendations for the new entrants
Covers market data for 2020, 2021, until 2025
Market trends (drivers, opportunities, threats, challenges, investment opportunities, and recommendations)
Strategic recommendations in key business segments based on the market estimations
Competitive landscaping mapping the key common trends
Company profiling with detailed strategies, financials, and recent developments
Supply chain trends mapping the latest technological advancements
Related Reports:
Breast Cancer Therapeutics Market by Product and Geography – Forecast and Analysis 2022-2026: The breast cancer therapeutics market share is expected to increase by USD 13.85 billion from 2021 to 2026.
Gastrointestinal Stromal Tumors Therapeutics Market by Route of Administration and Geography – Forecast and Analysis 2022-2026: The gastrointestinal stromal tumors therapeutics market share is expected to increase by USD 1.08 billion from 2021 to 2026.
Table of Contents:
1 Executive Summary
1.1 Market Overview
Exhibit 01: Executive Summary – Chart on Market Overview
Exhibit 02: Executive Summary – Data Table on Market Overview
Exhibit 03: Executive Summary – Chart on Global Market Characteristics
Exhibit 04: Executive Summary – Chart on Market by Geography
Exhibit 05: Executive Summary – Chart on Market Segmentation by Route of Administration
Exhibit 06: Executive Summary – Chart on Incremental Growth
Exhibit 07: Executive Summary – Data Table on Incremental Growth
Exhibit 08: Executive Summary – Chart on Vendor Market Positioning
2 Market Landscape
2.1 Market ecosystem
Exhibit 09: Parent market
Exhibit 10: Market Characteristics
3 Market Sizing
3.1 Market Definition
Exhibit 11: Offerings of vendors included in the market definition
3.2 Market segment analysis
Exhibit 12: Market segments
3.3 Market size 2021
3.4 Market outlook: Forecast for 2021-2026
Exhibit 13: Chart on Global - Market size and forecast 2021-2026 ($ million)
Exhibit 14: Data Table on Global - Market size and forecast 2021-2026 ($ million)
Exhibit 15: Chart on Global Market: Year-over-year growth 2021-2026 (%)
Exhibit 16: Data Table on Global Market: Year-over-year growth 2021-2026 (%)
4 Five Forces Analysis
4.1 Five forces summary
Exhibit 17: Five forces analysis - Comparison between 2021 and 2026
4.2 Bargaining power of buyers
Exhibit 18: Chart on Bargaining power of buyers – Impact of key factors 2021 and 2026
4.3 Bargaining power of suppliers
Exhibit 19: Bargaining power of suppliers – Impact of key factors in 2021 and 2026
4.4 Threat of new entrants
Exhibit 20: Threat of new entrants – Impact of key factors in 2021 and 2026
4.5 Threat of substitutes
Exhibit 21: Threat of substitutes – Impact of key factors in 2021 and 2026
4.6 Threat of rivalry
Exhibit 22: Threat of rivalry – Impact of key factors in 2021 and 2026
4.7 Market condition
Exhibit 23: Chart on Market condition - Five forces 2021 and 2026
5 Market Segmentation by Route of Administration
5.1 Market segments
Exhibit 24: Chart on Route of Administration - Market share 2021-2026 (%)
Exhibit 25: Data Table on Route of Administration - Market share 2021-2026 (%)
5.2 Comparison by Route of Administration
Exhibit 26: Chart on Comparison by Route of Administration
Exhibit 27: Data Table on Comparison by Route of Administration
5.3 Parenteral - Market size and forecast 2021-2026
Exhibit 28: Chart on Parenteral - Market size and forecast 2021-2026 ($ million)
Exhibit 29: Data Table on Parenteral - Market size and forecast 2021-2026 ($ million)
Exhibit 30: Chart on Parenteral - Year-over-year growth 2021-2026 (%)
Exhibit 31: Data Table on Parenteral - Year-over-year growth 2021-2026 (%)
5.4 Oral - Market size and forecast 2021-2026
Exhibit 32: Chart on Oral - Market size and forecast 2021-2026 ($ million)
Exhibit 33: Data Table on Oral - Market size and forecast 2021-2026 ($ million)
Exhibit 34: Chart on Oral - Year-over-year growth 2021-2026 (%)
Exhibit 35: Data Table on Oral - Year-over-year growth 2021-2026 (%)
5.5 Others - Market size and forecast 2021-2026
Exhibit 36: Chart on Others - Market size and forecast 2021-2026 ($ million)
Exhibit 37: Data Table on Others - Market size and forecast 2021-2026 ($ million)
Exhibit 38: Chart on Others - Year-over-year growth 2021-2026 (%)
Exhibit 39: Data Table on Others - Year-over-year growth 2021-2026 (%)
5.6 Market opportunity by Route of Administration
Exhibit 40: Market opportunity by Route of Administration ($ million)
6 Customer Landscape
6.1 Customer landscape overview
Exhibit 41: Analysis of price sensitivity, lifecycle, customer purchase basket, adoption rates, and purchase criteria
7 Geographic Landscape
7.1 Geographic segmentation
Exhibit 42: Chart on Market share by geography 2021-2026 (%)
Exhibit 43: Data Table on Market share by geography 2021-2026 (%)
7.2 Geographic comparison
Exhibit 44: Chart on Geographic comparison
Exhibit 45: Data Table on Geographic comparison
7.3 North America - Market size and forecast 2021-2026
Exhibit 46: Chart on North America - Market size and forecast 2021-2026 ($ million)
Exhibit 47: Data Table on North America - Market size and forecast 2021-2026 ($ million)
Exhibit 48: Chart on North America - Year-over-year growth 2021-2026 (%)
Exhibit 49: Data Table on North America - Year-over-year growth 2021-2026 (%)
7.4 Europe - Market size and forecast 2021-2026
Exhibit 50: Chart on Europe - Market size and forecast 2021-2026 ($ million)
Exhibit 51: Data Table on Europe - Market size and forecast 2021-2026 ($ million)
Exhibit 52: Chart on Europe - Year-over-year growth 2021-2026 (%)
Exhibit 53: Data Table on Europe - Year-over-year growth 2021-2026 (%)
7.5 Asia - Market size and forecast 2021-2026
Exhibit 54: Chart on Asia - Market size and forecast 2021-2026 ($ million)
Exhibit 55: Data Table on Asia - Market size and forecast 2021-2026 ($ million)
Exhibit 56: Chart on Asia - Year-over-year growth 2021-2026 (%)
Exhibit 57: Data Table on Asia - Year-over-year growth 2021-2026 (%)
7.6 Rest of World (ROW) - Market size and forecast 2021-2026
Exhibit 58: Chart on Rest of World (ROW) - Market size and forecast 2021-2026 ($ million)
Exhibit 59: Data Table on Rest of World (ROW) - Market size and forecast 2021-2026 ($ million)
Exhibit 60: Chart on Rest of World (ROW) - Year-over-year growth 2021-2026 (%)
Exhibit 61: Data Table on Rest of World (ROW) - Year-over-year growth 2021-2026 (%)
7.7 US - Market size and forecast 2021-2026
Exhibit 62: Chart on US - Market size and forecast 2021-2026 ($ million)
Exhibit 63: Data Table on US - Market size and forecast 2021-2026 ($ million)
Exhibit 64: Chart on US - Year-over-year growth 2021-2026 (%)
Exhibit 65: Data Table on US - Year-over-year growth 2021-2026 (%)
7.8 Germany - Market size and forecast 2021-2026
Exhibit 66: Chart on Germany - Market size and forecast 2021-2026 ($ million)
Exhibit 67: Data Table on Germany - Market size and forecast 2021-2026 ($ million)
Exhibit 68: Chart on Germany - Year-over-year growth 2021-2026 (%)
Exhibit 69: Data Table on Germany - Year-over-year growth 2021-2026 (%)
7.9 China - Market size and forecast 2021-2026
Exhibit 70: Chart on China - Market size and forecast 2021-2026 ($ million)
Exhibit 71: Data Table on China - Market size and forecast 2021-2026 ($ million)
Exhibit 72: Chart on China - Year-over-year growth 2021-2026 (%)
Exhibit 73: Data Table on China - Year-over-year growth 2021-2026 (%)
7.10 UK - Market size and forecast 2021-2026
Exhibit 74: Chart on UK - Market size and forecast 2021-2026 ($ million)
Exhibit 75: Data Table on UK - Market size and forecast 2021-2026 ($ million)
Exhibit 76: Chart on UK - Year-over-year growth 2021-2026 (%)
Exhibit 77: Data Table on UK - Year-over-year growth 2021-2026 (%)
7.11 Canada - Market size and forecast 2021-2026
Exhibit 78: Chart on Canada - Market size and forecast 2021-2026 ($ million)
Exhibit 79: Data Table on Canada - Market size and forecast 2021-2026 ($ million)
Exhibit 80: Chart on Canada - Year-over-year growth 2021-2026 (%)
Exhibit 81: Data Table on Canada - Year-over-year growth 2021-2026 (%)
7.12 Market opportunity by geography
Exhibit 82: Market opportunity by geography ($ million)
8 Drivers, Challenges, and Trends
8.1 Market drivers
8.2 Market challenges
8.3 Impact of drivers and challenges
Exhibit 83: Impact of drivers and challenges in 2021 and 2026
8.4 Market trends
9 Vendor Landscape
9.1 Overview
9.2 Vendor landscape
Exhibit 84: Overview on Criticality of inputs and Factors of differentiation
9.3 Landscape disruption
Exhibit 85: Overview on factors of disruption
9.4 Industry risks
Exhibit 86: Impact of key risks on business
10 Vendor Analysis
10.1 Vendors covered
Exhibit 87: Vendors covered
10.2 Market positioning of vendors
Exhibit 88: Matrix on vendor position and classification
10.3 Amgen Inc.
Exhibit 89: Amgen Inc. - Overview
Exhibit 90: Amgen Inc. - Product / Service
Exhibit 91: Amgen Inc. - Key offerings
10.4 AstraZeneca Plc
Exhibit 92: AstraZeneca Plc - Overview
Exhibit 93: AstraZeneca Plc - Product / Service
Exhibit 94: AstraZeneca Plc - Key news
Exhibit 95: AstraZeneca Plc - Key offerings
10.5 Eli Lilly and Co.
Exhibit 96: Eli Lilly and Co. - Overview
Exhibit 97: Eli Lilly and Co. - Product / Service
Exhibit 98: Eli Lilly and Co. - Key offerings
10.6 Ever Pharma
Exhibit 99: Ever Pharma - Overview
Exhibit 100: Ever Pharma - Product / Service
Exhibit 101: Ever Pharma - Key offerings
10.7 GlaxoSmithKline Plc
Exhibit 102: GlaxoSmithKline Plc - Overview
Exhibit 103: GlaxoSmithKline Plc - Business segments
Exhibit 104: GlaxoSmithKline Plc - Key news
Exhibit 105: GlaxoSmithKline Plc - Key offerings
Exhibit 106: GlaxoSmithKline Plc - Segment focus
10.8 Novo Nordisk AS
Exhibit 107: Novo Nordisk AS - Overview
Exhibit 108: Novo Nordisk AS - Business segments
Exhibit 109: Novo Nordisk AS - Key offerings
Exhibit 110: Novo Nordisk AS - Segment focus
10.9 Pfizer Inc.
Exhibit 111: Pfizer Inc. - Overview
Exhibit 112: Pfizer Inc. - Product / Service
Exhibit 113: Pfizer Inc. - Key news
Exhibit 114: Pfizer Inc. - Key offerings
10.10 Sanofi
Exhibit 115: Sanofi - Overview
Exhibit 116: Sanofi - Business segments
Exhibit 117: Sanofi - Key news
Exhibit 118: Sanofi - Key offerings
Exhibit 119: Sanofi - Segment focus
Exhibit 120: Takeda Pharmaceutical Co. Ltd. - Overview
Exhibit 121: Takeda Pharmaceutical Co. Ltd. - Product / Service
Exhibit 122: Takeda Pharmaceutical Co. Ltd. - Key news
Exhibit 123: Takeda Pharmaceutical Co. Ltd. - Key offerings
Exhibit 124: Teva Pharmaceutical Industries Ltd. - Overview
Exhibit 125: Teva Pharmaceutical Industries Ltd. - Business segments
Exhibit 126: Teva Pharmaceutical Industries Ltd. - Key news
Exhibit 127: Teva Pharmaceutical Industries Ltd. - Key offerings
Exhibit 128: Teva Pharmaceutical Industries Ltd. - Segment focus
11.1 Scope of the report
11.2 Inclusions and exclusions checklist
Exhibit 129: Inclusions checklist
Exhibit 130: Exclusions checklist
11.3 Currency conversion rates for US$
Exhibit 131: Currency conversion rates for US$
11.4 Research methodology
Exhibit 132: Research methodology
Exhibit 133: Validation techniques employed for market sizing
Exhibit 134: Information sources
11.5 List of abbreviations
Exhibit 135: List of abbreviations
About Us
Technavio is a leading global technology research and advisory company. Their research and analysis focus on emerging market trends and provide actionable insights to help businesses identify market opportunities and develop effective strategies to optimize their market positions. With over 500 specialized analysts, Technavio's report library consists of more than 17,000 reports and counting, covering 800 technologies, spanning 50 countries. Their client base consists of enterprises of all sizes, including more than 100 Fortune 500 companies. This growing client base relies on Technavio's comprehensive coverage, extensive research, and actionable market insights to identify opportunities in existing and potential markets and assess their competitive positions within changing market scenarios.
Contact
Technavio Research
Jesse Maida
US: +1 844 364 1100
UK: +44 203 893 3200
Email: [email protected]
Website: www.technavio.com/
SOURCE Technavio
更多内容,请访问原始网站
文中所述内容并不反映新药情报库及其所属公司任何意见及观点,如有版权侵扰或错误之处,请及时联系我们,我们会在24小时内配合处理。
靶点
-药物
-来和芽仔聊天吧


立即开始免费试用!
智慧芽新药情报库是智慧芽专为生命科学人士构建的基于AI的创新药情报平台,助您全方位提升您的研发与决策效率。
立即开始数据试用!
智慧芽新药库数据也通过智慧芽数据服务平台,以API或者数据包形式对外开放,助您更加充分利用智慧芽新药情报信息。