Global Imaging Agents Market to Reach $13.4 Billion by 2030
2023-02-13
诊断试剂
NEW YORK, Feb. 13, 2023 /PRNewswire/ -- The global economy is at a critical crossroads with a number of interlocking challenges and crises running in parallel. The uncertainty around how Russia`s war on Ukraine will play out this year and the war`s role in creating global instability means that the trouble on the inflation front is not over yet. Food and fuel inflation will remain a persistent economic problem. Higher retail inflation will impact consumer confidence and spending. As governments combat inflation by raising interest rates, new job creation will slowdown and impact economic activity and growth. Lower capital expenditure is in the offing as companies go slow on investments, held back by inflation worries and weaker demand. With slower growth and high inflation, developed markets seem primed to enter into a recession. Fears of new COVID outbreaks and China's already uncertain post-pandemic path poses a real risk of the world experiencing more acute supply chain pain and manufacturing disruptions this year. Volatile financial markets, growing trade tensions, stricter regulatory environment and pressure to mainstream climate change into economic decisions will compound the complexity of challenges faced. Year 2023 is expected to be tough year for most markets, investors and consumers. Nevertheless, there is always opportunity for businesses and their leaders who can chart a path forward with resilience and adaptability.
Continue Reading
Preview
来源: PRNewswire
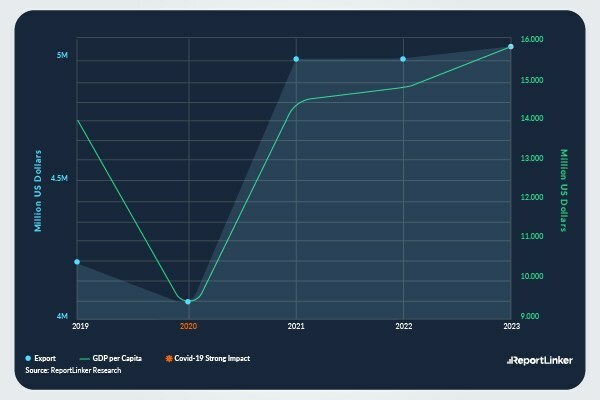
Source: ReportLinker Research
Read the full report: https://www.reportlinker.com/p0326398/?utm_source=PRN
Global Imaging Agents Market to Reach $13.4 Billion by 2030
In the changed post COVID-19 business landscape, the global market for Imaging Agents estimated at US$9.4 Billion in the year 2022, is projected to reach a revised size of US$13.4 Billion by 2030, growing at a CAGR of 4.5% over the analysis period 2022-2030. Diagnostic Radiopharmaceuticals, one of the segments analyzed in the report, is projected to record a 5.8% CAGR and reach US$7.2 Billion by the end of the analysis period. Taking into account the ongoing post pandemic recovery, growth in the X-Ray / CT segment is readjusted to a revised 3.3% CAGR for the next 8-year period.
The U.S. Market is Estimated at $2.6 Billion, While China is Forecast to Grow at 7.9% CAGR
The Imaging Agents market in the U.S. is estimated at US$2.6 Billion in the year 2022. China, the world`s second largest economy, is forecast to reach a projected market size of US$2.9 Billion by the year 2030 trailing a CAGR of 7.9% over the analysis period 2022 to 2030. Among the other noteworthy geographic markets are Japan and Canada, each forecast to grow at 2.2% and 3.8% respectively over the 2022-2030 period. Within Europe, Germany is forecast to grow at approximately 3% CAGR. Led by countries such as Australia, India, and South Korea, the market in Asia-Pacific is forecast to reach US$1.8 Billion by the year 2030.
Select Competitors (Total 23 Featured)
- Curium
Read the full report: https://www.reportlinker.com/p0326398/?utm_source=PRN
I. METHODOLOGY
II. EXECUTIVE SUMMARY
1. MARKET OVERVIEW
Influencer Market Insights
World Market Trajectories
Imaging Agents: Providing Brighter and Clearer Images for
Effective Clinical Diagnosis
Recent Market Activity
Major Growth Drivers in a Nutshell
Growing Need for Early Disease Diagnosis Fosters Demand for
Imaging Agents
Select Market Growth Restraints
Contrast Media: Giving Way to Contemporary Offshoots
X-ray/CT Segment Continues to Lead Contrast Media Market
Developed Economies Face Threat from Rising Demand for Contrast
Agents in Asia-Pacific
Diagnostic Radiopharmaceuticals to Outdo Contrast Media
Nuclear Medicine: A Potential Growth Avenue for Dx
Radiopharmaceuticals
Select PET and SPECT Radioisotopes Used in Nuclear Medicine
Select Cardiology and Oncology Radiopharmaceuticals
Developed Markets Rule the Imaging Agents Market, Developing
Regions to Spearhead Future Growth
Imaging Agents - Global Key Competitors Percentage Market Share
in 2022 (E)
Competitive Market Presence - Strong/Active/Niche/Trivial for
Players Worldwide in 2022 (E)
Impact of Covid-19 and a Looming Global Recession
2. FOCUS ON SELECT PLAYERS
Aytu BioScience, Inc. (USA)
Bayer Healthcare Pharmaceuticals (Germany)
Bracco Diagnostics, Inc. (USA)
Curium (France)
Daiichi Sankyo Company Limited (Japan)
Bracco-Eisai Co., Ltd (Japan)
Eli Lilly and Company (USA)
GE Healthcare (UK)
Guerbet Group (France)
Piramal Imaging SA (Switzerland)
3. MARKET TRENDS & DRIVERS
Sustained Expansion of Molecular Imaging Platform Presents
Positive Outlook
Novel Radiopharmaceuticals Add New Dimensions to Molecular Imaging
Latest Radiopharmaceuticals to Benefit Molecular Imaging
Microbubbles/Ultrasound Contrast Agents Set for Strong Growth
Growing Interest in Image Guided Surgery Offers New Opportunities
Role of Near-Infrared Contrast Agents for Image Guided Surgery
Fluorescence Optical Imaging - Opens New Avenues
Coronary CT Angiography Opens Up Opportunities for Contrast Agents
List of Iodine-Containing Contrast Agents for Coronary CT
Angiography
Targeted Imaging - A Game Changer in the Making
Rising Clinical Acceptance of MRI Systems Augurs Well for
Contrast Agents Market
Researchers Develop Iron Oxide-based Contrast Agent for MRI
Nanomaterials Taking the Center Stage
New Nanoparticle Contrast Agents on the Horizon Show Promise
Gadolinium Coated Nanoparticles - A Promising Imaging Agent
Growing Focus on Development of Gold Nanoparticles in X-Ray
Imaging
Imaging Agents Make a Welcome Impact in the Field of
List of FDA Approved Alzheimer's Diagnostic Imaging Agents
Contrast-Enhanced Tomosynthesis Expands Opportunities
Hyperpolarized Gases as Contrast Agents
Multi-Modal Imaging: Combating Contrast Medium Inconsistencies
Falling Prices Turn on the Heat
Ultrasound Contrast Agents in Diagnosis of Kidney Ailments
PET: A Prime Growth Driver for Diagnostic Radiopharmaceuticals
Innovative Radiotracers to Boost Cardiac Applications for SPECT
and PET Modalities
A Peek at Global CVD Stats
Echocardiography Examinations - Improving Diagnostic Quality
through Contrast Agents
Opportunities on Rise for Fluorine-Based Myocardial Perfusion
Agents
Unfounded Fears of Radiation Exposure: A Major Concern for
Rising Incidence of Cancer - A Major Growth Driver
World Cancer Statistics - Incidence and Mortality Data
Improving Healthcare Expenditure to Foster Growth
Aging Population - A Vital Demography
A Peek into Pricing Dynamics
Packaging of Contrast Agents - An Overview
Global Supply Shortages Restrains Radiopharmaceuticals Market
Price Sensitivity & Competition from Alternatives
Lack of Dosage Standards for Pediatric Patients Limits
Radiopharmaceutical Efficacy
Reimbursement Scenario
4. GLOBAL MARKET PERSPECTIVE
Table 1: World Recent Past, Current & Future Analysis for
Imaging Agents by Geographic Region - USA, Canada, Japan,
China, Europe, Asia-Pacific, Latin America, Middle East and
Africa Markets - Independent Analysis of Annual Sales in US$
Million for Years 2022 through 2030 and % CAGR
Table 2: World Historic Review for Imaging Agents by Geographic
Region - USA, Canada, Japan, China, Europe, Asia-Pacific, Latin
America, Middle East and Africa Markets - Independent Analysis
of Annual Sales in US$ Million for Years 2012 through 2021 and
% CAGR
Table 3: World 18-Year Perspective for Imaging Agents by
Geographic Region - Percentage Breakdown of Value Sales for
USA, Canada, Japan, China, Europe, Asia-Pacific, Latin America,
Middle East and Africa Markets for Years 2012, 2023 & 2030
Table 4: World Recent Past, Current & Future Analysis for
Diagnostic Radiopharmaceuticals by Geographic Region - USA,
Canada, Japan, China, Europe, Asia-Pacific, Latin America,
Middle East and Africa Markets - Independent Analysis of Annual
Sales in US$ Million for Years 2022 through 2030 and % CAGR
Table 5: World Historic Review for Diagnostic
Radiopharmaceuticals by Geographic Region - USA, Canada, Japan,
China, Europe, Asia-Pacific, Latin America, Middle East and
Africa Markets - Independent Analysis of Annual Sales in US$
Million for Years 2012 through 2021 and % CAGR
Table 6: World 18-Year Perspective for Diagnostic
Radiopharmaceuticals by Geographic Region - Percentage
Breakdown of Value Sales for USA, Canada, Japan, China, Europe,
Asia-Pacific, Latin America, Middle East and Africa for Years
2012, 2023 & 2030
Table 7: World Recent Past, Current & Future Analysis for MRI
by Geographic Region - USA, Canada, Japan, China, Europe,
Asia-Pacific, Latin America, Middle East and Africa Markets -
Independent Analysis of Annual Sales in US$ Million for Years
2022 through 2030 and % CAGR
Table 8: World Historic Review for MRI by Geographic Region -
USA, Canada, Japan, China, Europe, Asia-Pacific, Latin America,
Middle East and Africa Markets - Independent Analysis of Annual
Sales in US$ Million for Years 2012 through 2021 and % CAGR
Table 9: World 18-Year Perspective for MRI by Geographic Region -
Percentage Breakdown of Value Sales for USA, Canada, Japan,
China, Europe, Asia-Pacific, Latin America, Middle East and
Africa for Years 2012, 2023 & 2030
Table 10: World Recent Past, Current & Future Analysis for
Ultrasound by Geographic Region - USA, Canada, Japan, China,
Europe, Asia-Pacific, Latin America, Middle East and Africa
Markets - Independent Analysis of Annual Sales in US$ Million
for Years 2022 through 2030 and % CAGR
Table 11: World Historic Review for Ultrasound by Geographic
Region - USA, Canada, Japan, China, Europe, Asia-Pacific, Latin
America, Middle East and Africa Markets - Independent Analysis
of Annual Sales in US$ Million for Years 2012 through 2021 and
% CAGR
Table 12: World 18-Year Perspective for Ultrasound by
Geographic Region - Percentage Breakdown of Value Sales for
USA, Canada, Japan, China, Europe, Asia-Pacific, Latin America,
Middle East and Africa for Years 2012, 2023 & 2030
Table 13: World Recent Past, Current & Future Analysis for
X-Ray / CT by Geographic Region - USA, Canada, Japan, China,
Europe, Asia-Pacific, Latin America, Middle East and Africa
Markets - Independent Analysis of Annual Sales in US$ Million
for Years 2022 through 2030 and % CAGR
Table 14: World Historic Review for X-Ray / CT by Geographic
Region - USA, Canada, Japan, China, Europe, Asia-Pacific, Latin
America, Middle East and Africa Markets - Independent Analysis
of Annual Sales in US$ Million for Years 2012 through 2021 and
% CAGR
Table 15: World 18-Year Perspective for X-Ray / CT by
Geographic Region - Percentage Breakdown of Value Sales for
USA, Canada, Japan, China, Europe, Asia-Pacific, Latin America,
Middle East and Africa for Years 2012, 2023 & 2030
Table 16: World Imaging Agents Market Analysis of Annual Sales
in US$ Million for Years 2012 through 2030
III. MARKET ANALYSIS
UNITED STATES
Imaging Agents Market Presence - Strong/Active/Niche/Trivial -
Key Competitors in the United States for 2023 (E)
Table 17: USA Recent Past, Current & Future Analysis for
Imaging Agents by Product Segment - Diagnostic
Radiopharmaceuticals, X-Ray / CT, MRI and Ultrasound -
Independent Analysis of Annual Sales in US$ Million for the
Years 2022 through 2030 and % CAGR
Table 18: USA Historic Review for Imaging Agents by Product
Segment - Diagnostic Radiopharmaceuticals, X-Ray / CT, MRI and
Ultrasound Markets - Independent Analysis of Annual Sales in
US$ Million for Years 2012 through 2021 and % CAGR
Table 19: USA 18-Year Perspective for Imaging Agents by Product
Segment - Percentage Breakdown of Value Sales for Diagnostic
Radiopharmaceuticals, X-Ray / CT, MRI and Ultrasound for the
Years 2012, 2023 & 2030
CANADA
Table 20: Canada Recent Past, Current & Future Analysis for
Imaging Agents by Product Segment - Diagnostic
Radiopharmaceuticals, X-Ray / CT, MRI and Ultrasound -
Independent Analysis of Annual Sales in US$ Million for the
Years 2022 through 2030 and % CAGR
Table 21: Canada Historic Review for Imaging Agents by Product
Segment - Diagnostic Radiopharmaceuticals, X-Ray / CT, MRI and
Ultrasound Markets - Independent Analysis of Annual Sales in
US$ Million for Years 2012 through 2021 and % CAGR
Table 22: Canada 18-Year Perspective for Imaging Agents by
Product Segment - Percentage Breakdown of Value Sales for
Diagnostic Radiopharmaceuticals, X-Ray / CT, MRI and Ultrasound
for the Years 2012, 2023 & 2030
JAPAN
Imaging Agents Market Presence - Strong/Active/Niche/Trivial -
Key Competitors in Japan for 2023 (E)
Table 23: Japan Recent Past, Current & Future Analysis for
Imaging Agents by Product Segment - Diagnostic
Radiopharmaceuticals, X-Ray / CT, MRI and Ultrasound -
Independent Analysis of Annual Sales in US$ Million for the
Years 2022 through 2030 and % CAGR
Table 24: Japan Historic Review for Imaging Agents by Product
Segment - Diagnostic Radiopharmaceuticals, X-Ray / CT, MRI and
Ultrasound Markets - Independent Analysis of Annual Sales in
US$ Million for Years 2012 through 2021 and % CAGR
Table 25: Japan 18-Year Perspective for Imaging Agents by
Product Segment - Percentage Breakdown of Value Sales for
Diagnostic Radiopharmaceuticals, X-Ray / CT, MRI and Ultrasound
for the Years 2012, 2023 & 2030
CHINA
Imaging Agents Market Presence - Strong/Active/Niche/Trivial -
Key Competitors in China for 2023 (E)
Table 26: China Recent Past, Current & Future Analysis for
Imaging Agents by Product Segment - Diagnostic
Radiopharmaceuticals, X-Ray / CT, MRI and Ultrasound -
Independent Analysis of Annual Sales in US$ Million for the
Years 2022 through 2030 and % CAGR
Table 27: China Historic Review for Imaging Agents by Product
Segment - Diagnostic Radiopharmaceuticals, X-Ray / CT, MRI and
Ultrasound Markets - Independent Analysis of Annual Sales in
US$ Million for Years 2012 through 2021 and % CAGR
Table 28: China 18-Year Perspective for Imaging Agents by
Product Segment - Percentage Breakdown of Value Sales for
Diagnostic Radiopharmaceuticals, X-Ray / CT, MRI and Ultrasound
for the Years 2012, 2023 & 2030
EUROPE
Imaging Agents Market Presence - Strong/Active/Niche/Trivial -
Key Competitors in Europe for 2023 (E)
Table 29: Europe Recent Past, Current & Future Analysis for
Imaging Agents by Geographic Region - France, Germany, Italy,
UK, Spain, Russia and Rest of Europe Markets - Independent
Analysis of Annual Sales in US$ Million for Years 2022 through
2030 and % CAGR
Table 30: Europe Historic Review for Imaging Agents by
Geographic Region - France, Germany, Italy, UK, Spain, Russia
and Rest of Europe Markets - Independent Analysis of Annual
Sales in US$ Million for Years 2012 through 2021 and % CAGR
Table 31: Europe 18-Year Perspective for Imaging Agents by
Geographic Region - Percentage Breakdown of Value Sales for
France, Germany, Italy, UK, Spain, Russia and Rest of Europe
Markets for Years 2012, 2023 & 2030
Table 32: Europe Recent Past, Current & Future Analysis for
Imaging Agents by Product Segment - Diagnostic
Radiopharmaceuticals, X-Ray / CT, MRI and Ultrasound -
Independent Analysis of Annual Sales in US$ Million for the
Years 2022 through 2030 and % CAGR
Table 33: Europe Historic Review for Imaging Agents by Product
Segment - Diagnostic Radiopharmaceuticals, X-Ray / CT, MRI and
Ultrasound Markets - Independent Analysis of Annual Sales in
US$ Million for Years 2012 through 2021 and % CAGR
Table 34: Europe 18-Year Perspective for Imaging Agents by
Product Segment - Percentage Breakdown of Value Sales for
Diagnostic Radiopharmaceuticals, X-Ray / CT, MRI and Ultrasound
for the Years 2012, 2023 & 2030
FRANCE
Imaging Agents Market Presence - Strong/Active/Niche/Trivial -
Key Competitors in France for 2023 (E)
Table 35: France Recent Past, Current & Future Analysis for
Imaging Agents by Product Segment - Diagnostic
Radiopharmaceuticals, X-Ray / CT, MRI and Ultrasound -
Independent Analysis of Annual Sales in US$ Million for the
Years 2022 through 2030 and % CAGR
Table 36: France Historic Review for Imaging Agents by Product
Segment - Diagnostic Radiopharmaceuticals, X-Ray / CT, MRI and
Ultrasound Markets - Independent Analysis of Annual Sales in
US$ Million for Years 2012 through 2021 and % CAGR
Table 37: France 18-Year Perspective for Imaging Agents by
Product Segment - Percentage Breakdown of Value Sales for
Diagnostic Radiopharmaceuticals, X-Ray / CT, MRI and Ultrasound
for the Years 2012, 2023 & 2030
GERMANY
Imaging Agents Market Presence - Strong/Active/Niche/Trivial -
Key Competitors in Germany for 2023 (E)
Table 38: Germany Recent Past, Current & Future Analysis for
Imaging Agents by Product Segment - Diagnostic
Radiopharmaceuticals, X-Ray / CT, MRI and Ultrasound -
Independent Analysis of Annual Sales in US$ Million for the
Years 2022 through 2030 and % CAGR
Table 39: Germany Historic Review for Imaging Agents by Product
Segment - Diagnostic Radiopharmaceuticals, X-Ray / CT, MRI and
Ultrasound Markets - Independent Analysis of Annual Sales in
US$ Million for Years 2012 through 2021 and % CAGR
Table 40: Germany 18-Year Perspective for Imaging Agents by
Product Segment - Percentage Breakdown of Value Sales for
Diagnostic Radiopharmaceuticals, X-Ray / CT, MRI and Ultrasound
for the Years 2012, 2023 & 2030
ITALY
Table 41: Italy Recent Past, Current & Future Analysis for
Imaging Agents by Product Segment - Diagnostic
Radiopharmaceuticals, X-Ray / CT, MRI and Ultrasound -
Independent Analysis of Annual Sales in US$ Million for the
Years 2022 through 2030 and % CAGR
Table 42: Italy Historic Review for Imaging Agents by Product
Segment - Diagnostic Radiopharmaceuticals, X-Ray / CT, MRI and
Ultrasound Markets - Independent Analysis of Annual Sales in
US$ Million for Years 2012 through 2021 and % CAGR
Table 43: Italy 18-Year Perspective for Imaging Agents by
Product Segment - Percentage Breakdown of Value Sales for
Diagnostic Radiopharmaceuticals, X-Ray / CT, MRI and Ultrasound
for the Years 2012, 2023 & 2030
UNITED KINGDOM
Imaging Agents Market Presence - Strong/Active/Niche/Trivial -
Key Competitors in the United Kingdom for 2023 (E)
Table 44: UK Recent Past, Current & Future Analysis for Imaging
Agents by Product Segment - Diagnostic Radiopharmaceuticals,
X-Ray / CT, MRI and Ultrasound - Independent Analysis of Annual
Sales in US$ Million for the Years 2022 through 2030 and % CAGR
Table 45: UK Historic Review for Imaging Agents by Product
Segment - Diagnostic Radiopharmaceuticals, X-Ray / CT, MRI and
Ultrasound Markets - Independent Analysis of Annual Sales in
US$ Million for Years 2012 through 2021 and % CAGR
Table 46: UK 18-Year Perspective for Imaging Agents by Product
Segment - Percentage Breakdown of Value Sales for Diagnostic
Radiopharmaceuticals, X-Ray / CT, MRI and Ultrasound for the
Years 2012, 2023 & 2030
SPAIN
Table 47: Spain Recent Past, Current & Future Analysis for
Imaging Agents by Product Segment - Diagnostic
Radiopharmaceuticals, X-Ray / CT, MRI and Ultrasound -
Independent Analysis of Annual Sales in US$ Million for the
Years 2022 through 2030 and % CAGR
Table 48: Spain Historic Review for Imaging Agents by Product
Segment - Diagnostic Radiopharmaceuticals, X-Ray / CT, MRI and
Ultrasound Markets - Independent Analysis of Annual Sales in
US$ Million for Years 2012 through 2021 and % CAGR
Table 49: Spain 18-Year Perspective for Imaging Agents by
Product Segment - Percentage Breakdown of Value Sales for
Diagnostic Radiopharmaceuticals, X-Ray / CT, MRI and Ultrasound
for the Years 2012, 2023 & 2030
RUSSIA
Table 50: Russia Recent Past, Current & Future Analysis for
Imaging Agents by Product Segment - Diagnostic
Radiopharmaceuticals, X-Ray / CT, MRI and Ultrasound -
Independent Analysis of Annual Sales in US$ Million for the
Years 2022 through 2030 and % CAGR
Table 51: Russia Historic Review for Imaging Agents by Product
Segment - Diagnostic Radiopharmaceuticals, X-Ray / CT, MRI and
Ultrasound Markets - Independent Analysis of Annual Sales in
US$ Million for Years 2012 through 2021 and % CAGR
Table 52: Russia 18-Year Perspective for Imaging Agents by
Product Segment - Percentage Breakdown of Value Sales for
Diagnostic Radiopharmaceuticals, X-Ray / CT, MRI and Ultrasound
for the Years 2012, 2023 & 2030
REST OF EUROPE
Table 53: Rest of Europe Recent Past, Current & Future Analysis
for Imaging Agents by Product Segment - Diagnostic
Radiopharmaceuticals, X-Ray / CT, MRI and Ultrasound -
Independent Analysis of Annual Sales in US$ Million for the
Years 2022 through 2030 and % CAGR
Table 54: Rest of Europe Historic Review for Imaging Agents by
Product Segment - Diagnostic Radiopharmaceuticals, X-Ray / CT,
MRI and Ultrasound Markets - Independent Analysis of Annual
Sales in US$ Million for Years 2012 through 2021 and % CAGR
Table 55: Rest of Europe 18-Year Perspective for Imaging Agents
by Product Segment - Percentage Breakdown of Value Sales for
Diagnostic Radiopharmaceuticals, X-Ray / CT, MRI and Ultrasound
for the Years 2012, 2023 & 2030
ASIA-PACIFIC
Imaging Agents Market Presence - Strong/Active/Niche/Trivial -
Key Competitors in Asia-Pacific for 2023 (E)
Table 56: Asia-Pacific Recent Past, Current & Future Analysis
for Imaging Agents by Geographic Region - Australia, India,
South Korea and Rest of Asia-Pacific Markets - Independent
Analysis of Annual Sales in US$ Million for Years 2022 through
2030 and % CAGR
Table 57: Asia-Pacific Historic Review for Imaging Agents by
Geographic Region - Australia, India, South Korea and Rest of
Asia-Pacific Markets - Independent Analysis of Annual Sales in
US$ Million for Years 2012 through 2021 and % CAGR
Table 58: Asia-Pacific 18-Year Perspective for Imaging Agents
by Geographic Region - Percentage Breakdown of Value Sales for
Australia, India, South Korea and Rest of Asia-Pacific Markets
for Years 2012, 2023 & 2030
Table 59: Asia-Pacific Recent Past, Current & Future Analysis
for Imaging Agents by Product Segment - Diagnostic
Radiopharmaceuticals, X-Ray / CT, MRI and Ultrasound -
Independent Analysis of Annual Sales in US$ Million for the
Years 2022 through 2030 and % CAGR
Table 60: Asia-Pacific Historic Review for Imaging Agents by
Product Segment - Diagnostic Radiopharmaceuticals, X-Ray / CT,
MRI and Ultrasound Markets - Independent Analysis of Annual
Sales in US$ Million for Years 2012 through 2021 and % CAGR
Table 61: Asia-Pacific 18-Year Perspective for Imaging Agents
by Product Segment - Percentage Breakdown of Value Sales for
Diagnostic Radiopharmaceuticals, X-Ray / CT, MRI and Ultrasound
for the Years 2012, 2023 & 2030
AUSTRALIA
Imaging Agents Market Presence - Strong/Active/Niche/Trivial -
Key Competitors in Australia for 2023 (E)
Table 62: Australia Recent Past, Current & Future Analysis for
Imaging Agents by Product Segment - Diagnostic
Radiopharmaceuticals, X-Ray / CT, MRI and Ultrasound -
Independent Analysis of Annual Sales in US$ Million for the
Years 2022 through 2030 and % CAGR
Table 63: Australia Historic Review for Imaging Agents by
Product Segment - Diagnostic Radiopharmaceuticals, X-Ray / CT,
MRI and Ultrasound Markets - Independent Analysis of Annual
Sales in US$ Million for Years 2012 through 2021 and % CAGR
Table 64: Australia 18-Year Perspective for Imaging Agents by
Product Segment - Percentage Breakdown of Value Sales for
Diagnostic Radiopharmaceuticals, X-Ray / CT, MRI and Ultrasound
for the Years 2012, 2023 & 2030
INDIA
Imaging Agents Market Presence - Strong/Active/Niche/Trivial -
Key Competitors in India for 2023 (E)
Table 65: India Recent Past, Current & Future Analysis for
Imaging Agents by Product Segment - Diagnostic
Radiopharmaceuticals, X-Ray / CT, MRI and Ultrasound -
Independent Analysis of Annual Sales in US$ Million for the
Years 2022 through 2030 and % CAGR
Table 66: India Historic Review for Imaging Agents by Product
Segment - Diagnostic Radiopharmaceuticals, X-Ray / CT, MRI and
Ultrasound Markets - Independent Analysis of Annual Sales in
US$ Million for Years 2012 through 2021 and % CAGR
Table 67: India 18-Year Perspective for Imaging Agents by
Product Segment - Percentage Breakdown of Value Sales for
Diagnostic Radiopharmaceuticals, X-Ray / CT, MRI and Ultrasound
for the Years 2012, 2023 & 2030
SOUTH KOREA
Table 68: South Korea Recent Past, Current & Future Analysis
for Imaging Agents by Product Segment - Diagnostic
Radiopharmaceuticals, X-Ray / CT, MRI and Ultrasound -
Independent Analysis of Annual Sales in US$ Million for the
Years 2022 through 2030 and % CAGR
Table 69: South Korea Historic Review for Imaging Agents by
Product Segment - Diagnostic Radiopharmaceuticals, X-Ray / CT,
MRI and Ultrasound Markets - Independent Analysis of Annual
Sales in US$ Million for Years 2012 through 2021 and % CAGR
Table 70: South Korea 18-Year Perspective for Imaging Agents by
Product Segment - Percentage Breakdown of Value Sales for
Diagnostic Radiopharmaceuticals, X-Ray / CT, MRI and Ultrasound
for the Years 2012, 2023 & 2030
REST OF ASIA-PACIFIC
Table 71: Rest of Asia-Pacific Recent Past, Current & Future
Analysis for Imaging Agents by Product Segment - Diagnostic
Radiopharmaceuticals, X-Ray / CT, MRI and Ultrasound -
Independent Analysis of Annual Sales in US$ Million for the
Years 2022 through 2030 and % CAGR
Table 72: Rest of Asia-Pacific Historic Review for Imaging
Agents by Product Segment - Diagnostic Radiopharmaceuticals,
X-Ray / CT, MRI and Ultrasound Markets - Independent Analysis
of Annual Sales in US$ Million for Years 2012 through 2021 and
% CAGR
Table 73: Rest of Asia-Pacific 18-Year Perspective for Imaging
Agents by Product Segment - Percentage Breakdown of Value Sales
for Diagnostic Radiopharmaceuticals, X-Ray / CT, MRI and
Ultrasound for the Years 2012, 2023 & 2030
LATIN AMERICA
Imaging Agents Market Presence - Strong/Active/Niche/Trivial -
Key Competitors in Latin America for 2023 (E)
Table 74: Latin America Recent Past, Current & Future Analysis
for Imaging Agents by Geographic Region - Argentina, Brazil,
Mexico and Rest of Latin America Markets - Independent Analysis
of Annual Sales in US$ Million for Years 2022 through 2030 and
% CAGR
Table 75: Latin America Historic Review for Imaging Agents by
Geographic Region - Argentina, Brazil, Mexico and Rest of Latin
America Markets - Independent Analysis of Annual Sales in US$
Million for Years 2012 through 2021 and % CAGR
Table 76: Latin America 18-Year Perspective for Imaging Agents
by Geographic Region - Percentage Breakdown of Value Sales for
Argentina, Brazil, Mexico and Rest of Latin America Markets for
Years 2012, 2023 & 2030
Table 77: Latin America Recent Past, Current & Future Analysis
for Imaging Agents by Product Segment - Diagnostic
Radiopharmaceuticals, X-Ray / CT, MRI and Ultrasound -
Independent Analysis of Annual Sales in US$ Million for the
Years 2022 through 2030 and % CAGR
Table 78: Latin America Historic Review for Imaging Agents by
Product Segment - Diagnostic Radiopharmaceuticals, X-Ray / CT,
MRI and Ultrasound Markets - Independent Analysis of Annual
Sales in US$ Million for Years 2012 through 2021 and % CAGR
Table 79: Latin America 18-Year Perspective for Imaging Agents
by Product Segment - Percentage Breakdown of Value Sales for
Diagnostic Radiopharmaceuticals, X-Ray / CT, MRI and Ultrasound
for the Years 2012, 2023 & 2030
ARGENTINA
Table 80: Argentina Recent Past, Current & Future Analysis for
Imaging Agents by Product Segment - Diagnostic
Radiopharmaceuticals, X-Ray / CT, MRI and Ultrasound -
Independent Analysis of Annual Sales in US$ Million for the
Years 2022 through 2030 and % CAGR
Table 81: Argentina Historic Review for Imaging Agents by
Product Segment - Diagnostic Radiopharmaceuticals, X-Ray / CT,
MRI and Ultrasound Markets - Independent Analysis of Annual
Sales in US$ Million for Years 2012 through 2021 and % CAGR
Table 82: Argentina 18-Year Perspective for Imaging Agents by
Product Segment - Percentage Breakdown of Value Sales for
Diagnostic Radiopharmaceuticals, X-Ray / CT, MRI and Ultrasound
for the Years 2012, 2023 & 2030
BRAZIL
Table 83: Brazil Recent Past, Current & Future Analysis for
Imaging Agents by Product Segment - Diagnostic
Radiopharmaceuticals, X-Ray / CT, MRI and Ultrasound -
Independent Analysis of Annual Sales in US$ Million for the
Years 2022 through 2030 and % CAGR
Table 84: Brazil Historic Review for Imaging Agents by Product
Segment - Diagnostic Radiopharmaceuticals, X-Ray / CT, MRI and
Ultrasound Markets - Independent Analysis of Annual Sales in
US$ Million for Years 2012 through 2021 and % CAGR
Table 85: Brazil 18-Year Perspective for Imaging Agents by
Product Segment - Percentage Breakdown of Value Sales for
Diagnostic Radiopharmaceuticals, X-Ray / CT, MRI and Ultrasound
for the Years 2012, 2023 & 2030
MEXICO
Table 86: Mexico Recent Past, Current & Future Analysis for
Imaging Agents by Product Segment - Diagnostic
Radiopharmaceuticals, X-Ray / CT, MRI and Ultrasound -
Independent Analysis of Annual Sales in US$ Million for the
Years 2022 through 2030 and % CAGR
Table 87: Mexico Historic Review for Imaging Agents by Product
Segment - Diagnostic Radiopharmaceuticals, X-Ray / CT, MRI and
Ultrasound Markets - Independent Analysis of Annual Sales in
US$ Million for Years 2012 through 2021 and % CAGR
Table 88: Mexico 18-Year Perspective for Imaging Agents by
Product Segment - Percentage Breakdown of Value Sales for
Diagnostic Radiopharmaceuticals, X-Ray / CT, MRI and Ultrasound
for the Years 2012, 2023 & 2030
REST OF LATIN AMERICA
Table 89: Rest of Latin America Recent Past, Current & Future
Analysis for Imaging Agents by Product Segment - Diagnostic
Radiopharmaceuticals, X-Ray / CT, MRI and Ultrasound -
Independent Analysis of Annual Sales in US$ Million for the
Years 2022 through 2030 and % CAGR
Table 90: Rest of Latin America Historic Review for Imaging
Agents by Product Segment - Diagnostic Radiopharmaceuticals,
X-Ray / CT, MRI and Ultrasound Markets - Independent Analysis
of Annual Sales in US$ Million for Years 2012 through 2021 and
% CAGR
Table 91: Rest of Latin America 18-Year Perspective for Imaging
Agents by Product Segment - Percentage Breakdown of Value Sales
for Diagnostic Radiopharmaceuticals, X-Ray / CT, MRI and
Ultrasound for the Years 2012, 2023 & 2030
MIDDLE EAST
Imaging Agents Market Presence - Strong/Active/Niche/Trivial -
Key Competitors in Middle East for 2023 (E)
Table 92: Middle East Recent Past, Current & Future Analysis
for Imaging Agents by Geographic Region - Iran, Israel, Saudi
Arabia, UAE and Rest of Middle East Markets - Independent
Analysis of Annual Sales in US$ Million for Years 2022 through
2030 and % CAGR
Table 93: Middle East Historic Review for Imaging Agents by
Geographic Region - Iran, Israel, Saudi Arabia, UAE and Rest of
Middle East Markets - Independent Analysis of Annual Sales in
US$ Million for Years 2012 through 2021 and % CAGR
Table 94: Middle East 18-Year Perspective for Imaging Agents by
Geographic Region - Percentage Breakdown of Value Sales for
Iran, Israel, Saudi Arabia, UAE and Rest of Middle East Markets
for Years 2012, 2023 & 2030
Table 95: Middle East Recent Past, Current & Future Analysis
for Imaging Agents by Product Segment - Diagnostic
Radiopharmaceuticals, X-Ray / CT, MRI and Ultrasound -
Independent Analysis of Annual Sales in US$ Million for the
Years 2022 through 2030 and % CAGR
Table 96: Middle East Historic Review for Imaging Agents by
Product Segment - Diagnostic Radiopharmaceuticals, X-Ray / CT,
MRI and Ultrasound Markets - Independent Analysis of Annual
Sales in US$ Million for Years 2012 through 2021 and % CAGR
Table 97: Middle East 18-Year Perspective for Imaging Agents by
Product Segment - Percentage Breakdown of Value Sales for
Diagnostic Radiopharmaceuticals, X-Ray / CT, MRI and Ultrasound
for the Years 2012, 2023 & 2030
IRAN
Table 98: Iran Recent Past, Current & Future Analysis for
Imaging Agents by Product Segment - Diagnostic
Radiopharmaceuticals, X-Ray / CT, MRI and Ultrasound -
Independent Analysis of Annual Sales in US$ Million for the
Years 2022 through 2030 and % CAGR
Table 99: Iran Historic Review for Imaging Agents by Product
Segment - Diagnostic Radiopharmaceuticals, X-Ray / CT, MRI and
Ultrasound Markets - Independent Analysis of Annual Sales in
US$ Million for Years 2012 through 2021 and % CAGR
Table 100: Iran 18-Year Perspective for Imaging Agents by
Product Segment - Percentage Breakdown of Value Sales for
Diagnostic Radiopharmaceuticals, X-Ray / CT, MRI and Ultrasound
for the Years 2012, 2023 & 2030
ISRAEL
Table 101: Israel Recent Past, Current & Future Analysis for
Imaging Agents by Product Segment - Diagnostic
Radiopharmaceuticals, X-Ray / CT, MRI and Ultrasound -
Independent Analysis of Annual Sales in US$ Million for the
Years 2022 through 2030 and % CAGR
Table 102: Israel Historic Review for Imaging Agents by Product
Segment - Diagnostic Radiopharmaceuticals, X-Ray / CT, MRI and
Ultrasound Markets - Independent Analysis of Annual Sales in
US$ Million for Years 2012 through 2021 and % CAGR
Table 103: Israel 18-Year Perspective for Imaging Agents by
Product Segment - Percentage Breakdown of Value Sales for
Diagnostic Radiopharmaceuticals, X-Ray / CT, MRI and Ultrasound
for the Years 2012, 2023 & 2030
SAUDI ARABIA
Table 104: Saudi Arabia Recent Past, Current & Future Analysis
for Imaging Agents by Product Segment - Diagnostic
Radiopharmaceuticals, X-Ray / CT, MRI and Ultrasound -
Independent Analysis of Annual Sales in US$ Million for the
Years 2022 through 2030 and % CAGR
Table 105: Saudi Arabia Historic Review for Imaging Agents by
Product Segment - Diagnostic Radiopharmaceuticals, X-Ray / CT,
MRI and Ultrasound Markets - Independent Analysis of Annual
Sales in US$ Million for Years 2012 through 2021 and % CAGR
Table 106: Saudi Arabia 18-Year Perspective for Imaging Agents
by Product Segment - Percentage Breakdown of Value Sales for
Diagnostic Radiopharmaceuticals, X-Ray / CT, MRI and Ultrasound
for the Years 2012, 2023 & 2030
UNITED ARAB EMIRATES
Table 107: UAE Recent Past, Current & Future Analysis for
Imaging Agents by Product Segment - Diagnostic
Radiopharmaceuticals, X-Ray / CT, MRI and Ultrasound -
Independent Analysis of Annual Sales in US$ Million for the
Years 2022 through 2030 and % CAGR
Table 108: UAE Historic Review for Imaging Agents by Product
Segment - Diagnostic Radiopharmaceuticals, X-Ray / CT, MRI and
Ultrasound Markets - Independent Analysis of Annual Sales in
US$ Million for Years 2012 through 2021 and % CAGR
Table 109: UAE 18-Year Perspective for Imaging Agents by
Product Segment - Percentage Breakdown of Value Sales for
Diagnostic Radiopharmaceuticals, X-Ray / CT, MRI and Ultrasound
for the Years 2012, 2023 & 2030
REST OF MIDDLE EAST
Please contact our Customer Support Center to get the complete Table of Contents
Read the full report: https://www.reportlinker.com/p0326398/?utm_source=PRN
About Reportlinker
ReportLinker is an award-winning market research solution. Reportlinker finds and organizes the latest industry data so you get all the market research you need - instantly, in one place.
Contact Clare: [email protected]
US: (339)-368-6001
Intl: +1 339-368-6001
SOURCE Reportlinker
更多内容,请访问原始网站
文中所述内容并不反映新药情报库及其所属公司任何意见及观点,如有版权侵扰或错误之处,请及时联系我们,我们会在24小时内配合处理。
靶点
-药物
-热门报告


立即开始免费试用!
智慧芽新药情报库是智慧芽专为生命科学人士构建的基于AI的创新药情报平台,助您全方位提升您的研发与决策效率。
立即开始数据试用!
智慧芽新药库数据也通过智慧芽数据服务平台,以API或者数据包形式对外开放,助您更加充分利用智慧芽新药情报信息。