Allergy Relieving Eye Drops Market to record USD 354.94 Mn incremental growth -- Driven by high prevalence and incidence of eye infections
2022-09-26
仿制药
NEW YORK, Sept. 26, 2022 /PRNewswire/ -- The "
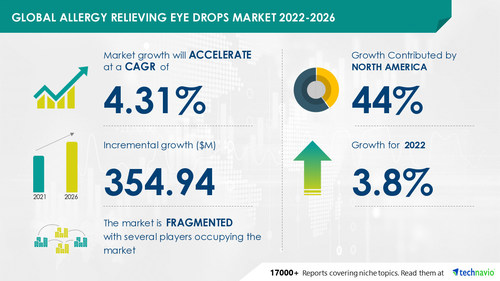
Allergy Relieving Eye Drops Market by Product and Geography - Forecast and Analysis 2022-2026" report has been added to Technavio's offering. The report expects the market to observe an incremental growth of USD 354.94 million, accelerating at a CAGR of 4.31% during the forecast period. The report has considered various factors including patient population, incidence rate of diseases, revenue generated by vendors, per capita income, GDP growth, and disposable incomes among others to estimate the size of the market.
Download PDF Report Sample
Continue Reading
Preview
来源: PRNewswire
Technavio has announced its latest market research report titled Global Allergy Relieving Eye Drops Market 2022-2026
Technavio identifies the pharmaceuticals market as the parent market for the global allergy relieving eye drops market. The parent market covers products and companies engaged in the R&D and production of generic drugs, non-generic drugs, and veterinary drugs. Factors such as the increasing life expectancy, growth in the geriatric population, and increasing government spending on healthcare are driving the growth of the parent market.
The market in focus is driven by the high prevalence and incidence of eye infections. The increasing adoption of generics will further accelerate the growth of the market. However, the side effects associated with antibiotics will challenge the growth of the global allergy relieving eye drops market during the forecast period.
The global allergy relieving eye drops market is fragmented. The market is characterized by the presence of leading players and several small and mid-sized players. Considering the market has been witnessing the patent expiry of major drugs over the last few years, generic players have a significant role in the market, which is intensifying the competition among the vendors in the market. Competitors have to focus on differentiating their product offerings with unique value propositions to strengthen their foothold in the market. Market vendors also have to leverage the existing growth prospects in the fast-growing segments, while maintaining their positions in the slow-growing segments.
The report identifies AbbVie Inc., Astellas Pharma Inc., Bausch Health Co. Inc., Dr. Reddys Laboratories Ltd., Johnson and Johnson services Inc, Lupin Ltd., Nicox SA, Novartis AG, Ocular Therapeutix Inc., Pfizer Inc., Prestige Consumer Healthcare Inc., ROHTO Pharmaceutical Co. Ltd., Rynel Clifton Pharma Pvt. Ltd., Santen Pharmaceutical Co. Ltd., Similasan Corp. USA, Starpharma Holdings Ltd., Sumitomo Pharma Co. Ltd., Sun Pharmaceutical Industries Ltd., and Teva Pharmaceutical Industries Ltd. as among some of the major market participants.
Request Sample PDF Report
Allergy Relieving Eye Drops Market 2022-2026: Segmentation
The global allergy relieving eye drops market is segmented as below:
Product
Antihistamines
Non-steroidal Anti-Inflammatory Drugs
Vasoconstrictors
Others
The market growth in the antihistamines segment will be significant over the forecast period. The segment is driven by the high therapeutic efficacy of antihistamines in treating the signs and symptoms associated with eye allergies.
Geography
North America
Europe
Asia
The Rest of the World (ROW)
44% of the market growth will originate from North America during the forecast period. The growth of the regional market can be attributed to the increased investments in R&D by large pharmaceutical companies and the presence of a proper regulatory framework for the approval of new drugs.
Technavio presents a detailed picture of the market by the way of study, synthesis, and summation of data from multiple sources. The allergy relieving eye drops market report covers the following areas:
Allergy Relieving Eye Drops Market Size
Allergy Relieving Eye Drops Market Trends
Allergy Relieving Eye Drops Market Industry Analysis
Allergy Relieving Eye Drops Market 2022-2026: Key Highlights
CAGR of the market during the forecast period 2022-2026
Detailed information on factors that will assist allergy relieving eye drops market growth during the next five years
Estimation of the allergy relieving eye drops market size and its contribution to the parent market
Predictions on upcoming trends and changes in consumer behavior
The growth of the allergy relieving eye drops market
Analysis of the market's competitive landscape and detailed information on vendors
Comprehensive details of factors that will challenge the growth of allergy relieving eye drops market vendors
Related Reports
Allergy Immunotherapies Market by Product and Geography - Forecast and Analysis 2021-2025
Allergy Rhinitis Drugs Market by Product and Geography - Forecast and Analysis 2020-2024
Table of Contents:
1 Executive Summary
1.1 Market overview
Exhibit 01: Executive Summary – Chart on Market Overview
Exhibit 02: Executive Summary – Data Table on Market Overview
Exhibit 03: Executive Summary – Chart on Global Market Characteristics
Exhibit 04: Executive Summary – Chart on Market by Geography
Exhibit 05: Executive Summary – Chart on Market Segmentation by Product
Exhibit 06: Executive Summary – Chart on Incremental Growth
Exhibit 07: Executive Summary – Data Table on Incremental Growth
Exhibit 08: Executive Summary – Chart on Vendor Market Positioning
2 Market Landscape
2.1 Market ecosystem
Exhibit 09: Parent market
Exhibit 10: Market Characteristics
3 Market Sizing
3.1 Market definition
Exhibit 11: Offerings of vendors included in the market definition
3.2 Market segment analysis
Exhibit 12: Market segments
3.3 Market size 2021
3.4 Market outlook: Forecast for 2021-2026
Exhibit 13: Chart on Global - Market size and forecast 2021-2026 ($ million)
Exhibit 14: Data Table on Global - Market size and forecast 2021-2026 ($ million)
Exhibit 15: Chart on Global Market: Year-over-year growth 2021-2026 (%)
Exhibit 16: Data Table on Global Market: Year-over-year growth 2021-2026 (%)
4 Five Forces Analysis
4.1 Five forces summary
Exhibit 17: Five forces analysis - Comparison between 2021 and 2026
4.2 Bargaining power of buyers
Exhibit 18: Chart on Bargaining power of buyers – Impact of key factors 2021 and 2026
4.3 Bargaining power of suppliers
Exhibit 19: Bargaining power of suppliers – Impact of key factors in 2021 and 2026
4.4 Threat of new entrants
Exhibit 20: Threat of new entrants – Impact of key factors in 2021 and 2026
4.5 Threat of substitutes
Exhibit 21: Threat of substitutes – Impact of key factors in 2021 and 2026
4.6 Threat of rivalry
Exhibit 22: Threat of rivalry – Impact of key factors in 2021 and 2026
4.7 Market condition
Exhibit 23: Chart on Market condition - Five forces 2021 and 2026
5 Market Segmentation by Product
5.1 Market segments
Exhibit 24: Chart on Product - Market share 2021-2026 (%)
Exhibit 25: Data Table on Product - Market share 2021-2026 (%)
5.2 Comparison by Product
Exhibit 26: Chart on Comparison by Product
Exhibit 27: Data Table on Comparison by Product
5.3 Antihistamines - Market size and forecast 2021-2026
Exhibit 28: Chart on Antihistamines - Market size and forecast 2021-2026 ($ million)
Exhibit 29: Data Table on Antihistamines - Market size and forecast 2021-2026 ($ million)
Exhibit 30: Chart on Antihistamines - Year-over-year growth 2021-2026 (%)
Exhibit 31: Data Table on Antihistamines - Year-over-year growth 2021-2026 (%)
5.4 Non-steroidal anti-Inflammatory drugs - Market size and forecast 2021-2026
Exhibit 32: Chart on Non-steroidal anti-Inflammatory drugs - Market size and forecast 2021-2026 ($ million)
Exhibit 33: Data Table on Non-steroidal anti-Inflammatory drugs - Market size and forecast 2021-2026 ($ million)
Exhibit 34: Chart on Non-steroidal anti-Inflammatory drugs - Year-over-year growth 2021-2026 (%)
Exhibit 35: Data Table on Non-steroidal anti-Inflammatory drugs - Year-over-year growth 2021-2026 (%)
5.5 Vasoconstrictors - Market size and forecast 2021-2026
Exhibit 36: Chart on Vasoconstrictors - Market size and forecast 2021-2026 ($ million)
Exhibit 37: Data Table on Vasoconstrictors - Market size and forecast 2021-2026 ($ million)
Exhibit 38: Chart on Vasoconstrictors - Year-over-year growth 2021-2026 (%)
Exhibit 39: Data Table on Vasoconstrictors - Year-over-year growth 2021-2026 (%)
5.6 Others - Market size and forecast 2021-2026
Exhibit 40: Chart on Others - Market size and forecast 2021-2026 ($ million)
Exhibit 41: Data Table on Others - Market size and forecast 2021-2026 ($ million)
Exhibit 42: Chart on Others - Year-over-year growth 2021-2026 (%)
Exhibit 43: Data Table on Others - Year-over-year growth 2021-2026 (%)
5.7 Market opportunity by Product
Exhibit 44: Market opportunity by Product ($ million)
6 Customer Landscape
6.1 Customer landscape overview
Exhibit 45: Analysis of price sensitivity, lifecycle, customer purchase basket, adoption rates, and purchase criteria
7 Geographic Landscape
7.1 Geographic segmentation
Exhibit 46: Chart on Market share by geography 2021-2026 (%)
Exhibit 47: Data Table on Market share by geography 2021-2026 (%)
7.2 Geographic comparison
Exhibit 48: Chart on Geographic comparison
Exhibit 49: Data Table on Geographic comparison
7.3 North America - Market size and forecast 2021-2026
Exhibit 50: Chart on North America - Market size and forecast 2021-2026 ($ million)
Exhibit 51: Data Table on North America - Market size and forecast 2021-2026 ($ million)
Exhibit 52: Chart on North America - Year-over-year growth 2021-2026 (%)
Exhibit 53: Data Table on North America - Year-over-year growth 2021-2026 (%)
7.4 Europe - Market size and forecast 2021-2026
Exhibit 54: Chart on Europe - Market size and forecast 2021-2026 ($ million)
Exhibit 55: Data Table on Europe - Market size and forecast 2021-2026 ($ million)
Exhibit 56: Chart on Europe - Year-over-year growth 2021-2026 (%)
Exhibit 57: Data Table on Europe - Year-over-year growth 2021-2026 (%)
7.5 Asia - Market size and forecast 2021-2026
Exhibit 58: Chart on Asia - Market size and forecast 2021-2026 ($ million)
Exhibit 59: Data Table on Asia - Market size and forecast 2021-2026 ($ million)
Exhibit 60: Chart on Asia - Year-over-year growth 2021-2026 (%)
Exhibit 61: Data Table on Asia - Year-over-year growth 2021-2026 (%)
7.6 Rest of World (ROW) - Market size and forecast 2021-2026
Exhibit 62: Chart on Rest of World (ROW) - Market size and forecast 2021-2026 ($ million)
Exhibit 63: Data Table on Rest of World (ROW) - Market size and forecast 2021-2026 ($ million)
Exhibit 64: Chart on Rest of World (ROW) - Year-over-year growth 2021-2026 (%)
Exhibit 65: Data Table on Rest of World (ROW) - Year-over-year growth 2021-2026 (%)
7.7 US - Market size and forecast 2021-2026
Exhibit 66: Chart on US - Market size and forecast 2021-2026 ($ million)
Exhibit 67: Data Table on US - Market size and forecast 2021-2026 ($ million)
Exhibit 68: Chart on US - Year-over-year growth 2021-2026 (%)
Exhibit 69: Data Table on US - Year-over-year growth 2021-2026 (%)
7.8 Germany - Market size and forecast 2021-2026
Exhibit 70: Chart on Germany - Market size and forecast 2021-2026 ($ million)
Exhibit 71: Data Table on Germany - Market size and forecast 2021-2026 ($ million)
Exhibit 72: Chart on Germany - Year-over-year growth 2021-2026 (%)
Exhibit 73: Data Table on Germany - Year-over-year growth 2021-2026 (%)
7.9 UK - Market size and forecast 2021-2026
Exhibit 74: Chart on UK - Market size and forecast 2021-2026 ($ million)
Exhibit 75: Data Table on UK - Market size and forecast 2021-2026 ($ million)
Exhibit 76: Chart on UK - Year-over-year growth 2021-2026 (%)
Exhibit 77: Data Table on UK - Year-over-year growth 2021-2026 (%)
7.10 Canada - Market size and forecast 2021-2026
Exhibit 78: Chart on Canada - Market size and forecast 2021-2026 ($ million)
Exhibit 79: Data Table on Canada - Market size and forecast 2021-2026 ($ million)
Exhibit 80: Chart on Canada - Year-over-year growth 2021-2026 (%)
Exhibit 81: Data Table on Canada - Year-over-year growth 2021-2026 (%)
7.11 China - Market size and forecast 2021-2026
Exhibit 82: Chart on China - Market size and forecast 2021-2026 ($ million)
Exhibit 83: Data Table on China - Market size and forecast 2021-2026 ($ million)
Exhibit 84: Chart on China - Year-over-year growth 2021-2026 (%)
Exhibit 85: Data Table on China - Year-over-year growth 2021-2026 (%)
7.12 Market opportunity by geography
Exhibit 86: Market opportunity by geography ($ million)
8 Drivers, Challenges, and Trends
8.1 Market drivers
8.2 Market challenges
8.3 Impact of drivers and challenges
Exhibit 87: Impact of drivers and challenges in 2021 and 2026
8.4 Market trends
9 Vendor Landscape
9.1 Overview
9.2 Vendor landscape
Exhibit 88: Overview on Criticality of inputs and Factors of differentiation
9.3 Landscape disruption
Exhibit 89: Overview on factors of disruption
9.4 Industry risks
Exhibit 90: Impact of key risks on business
10 Vendor Analysis
10.1 Vendors covered
Exhibit 91: Vendors covered
10.2 Market positioning of vendors
Exhibit 92: Matrix on vendor position and classification
10.3 AbbVie Inc.
Exhibit 93: AbbVie Inc. - Overview
Exhibit 94: AbbVie Inc. - Product / Service
Exhibit 95: AbbVie Inc. - Key offerings
10.4 Astellas Pharma Inc.
Exhibit 96: Astellas Pharma Inc. - Overview
Exhibit 97: Astellas Pharma Inc. - Product / Service
Exhibit 98: Astellas Pharma Inc. - Key news
Exhibit 99: Astellas Pharma Inc. - Key offerings
Exhibit 100: Bausch Health Co. Inc. - Overview
Exhibit 101: Bausch Health Co. Inc. - Business segments
Exhibit 102: Bausch Health Co. Inc. - Key news
Exhibit 103: Bausch Health Co. Inc. - Key offerings
Exhibit 104: Bausch Health Co. Inc. - Segment focus
10.6 Dr. Reddys Laboratories Ltd.
Exhibit 105: Dr. Reddys Laboratories Ltd. - Overview
Exhibit 106: Dr. Reddys Laboratories Ltd. - Business segments
Exhibit 107: Dr. Reddys Laboratories Ltd. - Key offerings
Exhibit 108: Dr. Reddys Laboratories Ltd. - Segment focus
10.7 Johnson and Johnson services Inc
Exhibit 109: Johnson and Johnson services Inc - Overview
Exhibit 110: Johnson and Johnson services Inc - Business segments
Exhibit 111: Johnson and Johnson services Inc - Key news
Exhibit 112: Johnson and Johnson services Inc - Key offerings
Exhibit 113: Johnson and Johnson services Inc - Segment focus
10.8 Novartis AG
Exhibit 114: Novartis AG - Overview
Exhibit 115: Novartis AG - Business segments
Exhibit 116: Novartis AG - Key offerings
Exhibit 117: Novartis AG - Segment focus
10.9 Pfizer Inc.
Exhibit 118: Pfizer Inc. - Overview
Exhibit 119: Pfizer Inc. - Product / Service
Exhibit 120: Pfizer Inc. - Key news
Exhibit 121: Pfizer Inc. - Key offerings
Exhibit 122: Santen Pharmaceutical Co. Ltd. - Overview
Exhibit 123: Santen Pharmaceutical Co. Ltd. - Product / Service
Exhibit 124: Santen Pharmaceutical Co. Ltd. - Key offerings
10.11 Sumitomo Pharma Co. Ltd.
Exhibit 125: Sumitomo Pharma Co. Ltd. - Overview
Exhibit 126: Sumitomo Pharma Co. Ltd. - Business segments
Exhibit 127: Sumitomo Pharma Co. Ltd. - Key offerings
Exhibit 128: Sumitomo Pharma Co. Ltd. - Segment focus
Exhibit 129: Teva Pharmaceutical Industries Ltd. - Overview
Exhibit 130: Teva Pharmaceutical Industries Ltd. - Business segments
Exhibit 131: Teva Pharmaceutical Industries Ltd. - Key news
Exhibit 132: Teva Pharmaceutical Industries Ltd. - Key offerings
Exhibit 133: Teva Pharmaceutical Industries Ltd. - Segment focus
11.1 Scope of the report
11.2 Inclusions and exclusions checklist
Exhibit 134: Inclusions checklist
Exhibit 135: Exclusions checklist
11.3 Currency conversion rates for US$
Exhibit 136: Currency conversion rates for US$
11.4 Research methodology
Exhibit 137: Research methodology
Exhibit 138: Validation techniques employed for market sizing
Exhibit 139: Information sources
11.5 List of abbreviations
Exhibit 140: List of abbreviations
sales: Price when sold from manufacturer to wholesaler or directly to pharmacies as reported by vendors in the industry. The market size excludes all discounts and allowances, returns, chargebacks, and government rebates such as Medicaid and Medicare.
About Us
Technavio is a leading global technology research and advisory company. Their research and analysis focus on emerging market trends and provides actionable insights to help businesses identify market opportunities and develop effective strategies to optimize their market positions. With over 500 specialized analysts, Technavio's report library consists of more than 17,000 reports and counting, covering 800 technologies, spanning across 50 countries. Their client base consists of enterprises of all sizes, including more than 100 Fortune 500 companies. This growing client base relies on Technavio's comprehensive coverage, extensive research, and actionable market insights to identify opportunities in existing and potential markets and assess their competitive positions within changing market scenarios.
Contact
Technavio Research
Jesse Maida
US: +1 844 364 1100
UK: +44 203 893 3200
Email: [email protected]
Website: www.technavio.com/
SOURCE Technavio
更多内容,请访问原始网站
文中所述内容并不反映新药情报库及其所属公司任何意见及观点,如有版权侵扰或错误之处,请及时联系我们,我们会在24小时内配合处理。
靶点
-药物
-热门报告


立即开始免费试用!
智慧芽新药情报库是智慧芽专为生命科学人士构建的基于AI的创新药情报平台,助您全方位提升您的研发与决策效率。
立即开始数据试用!
智慧芽新药库数据也通过智慧芽数据服务平台,以API或者数据包形式对外开放,助您更加充分利用智慧芽新药情报信息。