Ventricular Drainage Devices Market Size to Grow by USD 284.64 million, Increasing Prevalence of Brain Surgeries to Drive Growth - Technavio
2022-08-17
NEW YORK, Aug. 17, 2022 /PRNewswire/ -- A ventricular drainage device allows the drainage of CSF from the ventricles to an external closed system. Factors such as TBI, including intracranial hemorrhage with intraventricular extension, subarachnoid hemorrhage, brain tumor, and bacterial meningitis, can lead to the accumulation of CSF.
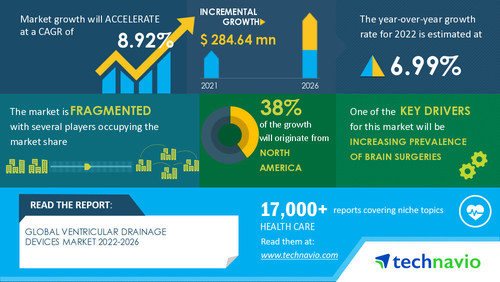
According to Technavio, the ventricular drainage devices market size is estimated to grow by USD 284.64 mn from 2021 to 2026. In addition, the report projects that the growth momentum of the market will accelerate at a CAGR of 8.92%.
Continue Reading
Preview
来源: PRNewswire
Latest market research report titled Ventricular Drainage Devices Market by Product and Geography - Forecast and Analysis 2022-2026 has been announced by Technavio which is proudly partnering with Fortune 500 companies for over 16 years
Technavio offers an up-to-date analysis of the current global market scenario and the overall market environment.
Download FREE PDF Sample Report
Ventricular Drainage Devices Market: Driver and Trend
The
increasing prevalence of brain surgeries is driving the growth of the market. The incidence of TBI has increased owing to the rising prevalence of chronic conditions such as Alzheimer's and osteoporosis and the growing number of road accidents. Moreover, the rising number of road accidents has contributed to the increasing number of brain surgeries. For instance, as per the CDC, approximately 2 million people in the US are injured because of motor vehicle crashes. The high incidence of brain tumors will also increase the need for ventricular drainage devices in safe and effective surgeries.
The
growing neurology specialty hospitals and clinics is a trend in the market. Various hospitals are establishing brain injury rehabilitation centers due to the increasing prevalence of brain disorders and TBI resulting in brain surgeries. For instance, the Barrow Neurological Institute offers an intensive day program to help people gain the skills they need to transition into work, schools, or communities after surgery, under the Center for Transitional Neuro-Rehabilitation. Such programs will further propel market growth in the coming years.
Technavio provides major trends and drivers that will shape the future of the market.
Request a FREE PDF Sample
Ventricular Drainage Devices Market: Segmentation Analysis
This report segments the ventricular drainage devices market by product (ventricular drainage accessories and ventricular drainage systems) and geography (North America, Europe, Asia, and Rest of World (ROW)).
By geography,
North America will account for 38% of the market's growth during the forecast period. The growth of the market is attributed to the increasing prevalence of traumatic brain injuries, rising prevalence of brain tumors and cancer injuries, the presence of prominent vendors, and growing government initiatives. Market growth in this region will be faster than the growth of the market in other regions. The US and Canada are the key countries for the ventricular drainage devices market in North America.
By product, the
ventricular drainage accessories segment will contribute the largest market share growth during the forecast period. The availability of a broad range of accessories with ventricular drainage systems enables vendors to offer one-stop solutions to end-users, which increases their sales. For instance, Medtronic develops subdural evacuating port systems for the bedside treatment of chronic and subacute subdural hematomas.
Learn about the contribution of each segment summarized in concise infographics and thorough descriptions.
Buy Now
to gain access to exclusive information about the segments
Related Reports
Surgical Pliers Market by Type and Geography - Forecast and Analysis 2022-2026
Surgical Site Infection Control Market by Type and Geography - Forecast and Analysis 2022-2026
Browse
Market Reports
Table of Contents
1 Executive Summary
1.1 Market overview
Exhibit 01: Executive Summary – Chart on Market Overview
Exhibit 02: Executive Summary – Data Table on Market Overview
Exhibit 03: Executive Summary – Chart on Global Market Characteristics
Exhibit 04: Executive Summary – Chart on Market by Geography
Exhibit 05: Executive Summary – Chart on Market Segmentation by Product
Exhibit 06: Executive Summary – Chart on Incremental Growth
Exhibit 07: Executive Summary – Data Table on Incremental Growth
Exhibit 08: Executive Summary – Chart on Vendor Market Positioning
2 Market Landscape
2.1 Market ecosystem
Exhibit 09: Parent market
Exhibit 10: Market Characteristics
3 Market Sizing
3.1 Market definition
Exhibit 11: Offerings of vendors included in the market definition
3.2 Market segment analysis
Exhibit 12: Market segments
3.3 Market size 2021
3.4 Market outlook: Forecast for 2021-2026
Exhibit 13: Chart on Global - Market size and forecast 2021-2026 ($ million)
Exhibit 14: Data Table on Global - Market size and forecast 2021-2026 ($ million)
Exhibit 15: Chart on Global Market: Year-over-year growth 2021-2026 (%)
Exhibit 16: Data Table on Global Market: Year-over-year growth 2021-2026 (%)
4 Five Forces Analysis
4.1 Five forces summary
Exhibit 17: Five forces analysis - Comparison between 2021 and 2026
4.2 Bargaining power of buyers
Exhibit 18: Chart on Bargaining power of buyers – Impact of key factors 2021 and 2026
4.3 Bargaining power of suppliers
Exhibit 19: Bargaining power of suppliers – Impact of key factors in 2021 and 2026
4.4 Threat of new entrants
Exhibit 20: Threat of new entrants – Impact of key factors in 2021 and 2026
4.5 Threat of substitutes
Exhibit 21: Threat of substitutes – Impact of key factors in 2021 and 2026
4.6 Threat of rivalry
Exhibit 22: Threat of rivalry – Impact of key factors in 2021 and 2026
4.7 Market condition
Exhibit 23: Chart on Market condition - Five forces 2021 and 2026
5 Market Segmentation by Product
5.1 Market segments
Exhibit 24: Chart on Product - Market share 2021-2026 (%)
Exhibit 25: Data Table on Product - Market share 2021-2026 (%)
5.2 Comparison by Product
Exhibit 26: Chart on Comparison by Product
Exhibit 27: Data Table on Comparison by Product
5.3 Ventricular drainage accessories - Market size and forecast 2021-2026
Exhibit 28: Chart on Ventricular drainage accessories - Market size and forecast 2021-2026 ($ million)
Exhibit 29: Data Table on Ventricular drainage accessories - Market size and forecast 2021-2026 ($ million)
Exhibit 30: Chart on Ventricular drainage accessories - Year-over-year growth 2021-2026 (%)
Exhibit 31: Data Table on Ventricular drainage accessories - Year-over-year growth 2021-2026 (%)
5.4 Ventricular drainage systems - Market size and forecast 2021-2026
Exhibit 32: Chart on Ventricular drainage systems - Market size and forecast 2021-2026 ($ million)
Exhibit 33: Data Table on Ventricular drainage systems - Market size and forecast 2021-2026 ($ million)
Exhibit 34: Chart on Ventricular drainage systems - Year-over-year growth 2021-2026 (%)
Exhibit 35: Data Table on Ventricular drainage systems - Year-over-year growth 2021-2026 (%)
5.5 Market opportunity by Product
Exhibit 36: Market opportunity by Product ($ million)
6 Customer Landscape
6.1 Customer landscape overview
Exhibit 37: Analysis of price sensitivity, lifecycle, customer purchase basket, adoption rates, and purchase criteria
7 Geographic Landscape
7.1 Geographic segmentation
Exhibit 38: Chart on Market share by geography 2021-2026 (%)
Exhibit 39: Data Table on Market share by geography 2021-2026 (%)
7.2 Geographic comparison
Exhibit 40: Chart on Geographic comparison
Exhibit 41: Data Table on Geographic comparison
7.3 North America - Market size and forecast 2021-2026
Exhibit 42: Chart on North America - Market size and forecast 2021-2026 ($ million)
Exhibit 43: Data Table on North America - Market size and forecast 2021-2026 ($ million)
Exhibit 44: Chart on North America - Year-over-year growth 2021-2026 (%)
Exhibit 45: Data Table on North America - Year-over-year growth 2021-2026 (%)
7.4 Europe - Market size and forecast 2021-2026
Exhibit 46: Chart on Europe - Market size and forecast 2021-2026 ($ million)
Exhibit 47: Data Table on Europe - Market size and forecast 2021-2026 ($ million)
Exhibit 48: Chart on Europe - Year-over-year growth 2021-2026 (%)
Exhibit 49: Data Table on Europe - Year-over-year growth 2021-2026 (%)
7.5 Asia - Market size and forecast 2021-2026
Exhibit 50: Chart on Asia - Market size and forecast 2021-2026 ($ million)
Exhibit 51: Data Table on Asia - Market size and forecast 2021-2026 ($ million)
Exhibit 52: Chart on Asia - Year-over-year growth 2021-2026 (%)
Exhibit 53: Data Table on Asia - Year-over-year growth 2021-2026 (%)
7.6 Rest of World (ROW) - Market size and forecast 2021-2026
Exhibit 54: Chart on Rest of World (ROW) - Market size and forecast 2021-2026 ($ million)
Exhibit 55: Data Table on Rest of World (ROW) - Market size and forecast 2021-2026 ($ million)
Exhibit 56: Chart on Rest of World (ROW) - Year-over-year growth 2021-2026 (%)
Exhibit 57: Data Table on Rest of World (ROW) - Year-over-year growth 2021-2026 (%)
7.7 US - Market size and forecast 2021-2026
Exhibit 58: Chart on US - Market size and forecast 2021-2026 ($ million)
Exhibit 59: Data Table on US - Market size and forecast 2021-2026 ($ million)
Exhibit 60: Chart on US - Year-over-year growth 2021-2026 (%)
Exhibit 61: Data Table on US - Year-over-year growth 2021-2026 (%)
7.8 Germany - Market size and forecast 2021-2026
Exhibit 62: Chart on Germany - Market size and forecast 2021-2026 ($ million)
Exhibit 63: Data Table on Germany - Market size and forecast 2021-2026 ($ million)
Exhibit 64: Chart on Germany - Year-over-year growth 2021-2026 (%)
Exhibit 65: Data Table on Germany - Year-over-year growth 2021-2026 (%)
7.9 China - Market size and forecast 2021-2026
Exhibit 66: Chart on China - Market size and forecast 2021-2026 ($ million)
Exhibit 67: Data Table on China - Market size and forecast 2021-2026 ($ million)
Exhibit 68: Chart on China - Year-over-year growth 2021-2026 (%)
Exhibit 69: Data Table on China - Year-over-year growth 2021-2026 (%)
7.10 Canada - Market size and forecast 2021-2026
Exhibit 70: Chart on Canada - Market size and forecast 2021-2026 ($ million)
Exhibit 71: Data Table on Canada - Market size and forecast 2021-2026 ($ million)
Exhibit 72: Chart on Canada - Year-over-year growth 2021-2026 (%)
Exhibit 73: Data Table on Canada - Year-over-year growth 2021-2026 (%)
7.11 UK - Market size and forecast 2021-2026
Exhibit 74: Chart on UK - Market size and forecast 2021-2026 ($ million)
Exhibit 75: Data Table on UK - Market size and forecast 2021-2026 ($ million)
Exhibit 76: Chart on UK - Year-over-year growth 2021-2026 (%)
Exhibit 77: Data Table on UK - Year-over-year growth 2021-2026 (%)
7.12 Market opportunity by geography
Exhibit 78: Market opportunity by geography ($ million)
8 Drivers, Challenges, and Trends
8.1 Market drivers
8.2 Market challenges
8.3 Impact of drivers and challenges
Exhibit 79: Impact of drivers and challenges in 2021 and 2026
8.4 Market trends
9 Vendor Landscape
9.1 Overview
9.2 Vendor landscape
Exhibit 80: Overview on Criticality of inputs and Factors of differentiation
9.3 Landscape disruption
Exhibit 81: Overview on factors of disruption
9.4 Industry risks
Exhibit 82: Impact of key risks on business
10 Vendor Analysis
10.1 Vendors covered
Exhibit 83: Vendors covered
10.2 Market positioning of vendors
Exhibit 84: Matrix on vendor position and classification
10.3 B. Braun SE
Exhibit 85: B. Braun SE - Overview
Exhibit 86: B. Braun SE - Business segments
Exhibit 87: B. Braun SE - Key news
Exhibit 88: B. Braun SE - Key offerings
Exhibit 89: B. Braun SE - Segment focus
10.4 Desu Medical
Exhibit 90: Desu Medical - Overview
Exhibit 91: Desu Medical - Product / Service
Exhibit 92: Desu Medical - Key offerings
Exhibit 93: Fuji Systems Co. Ltd. - Overview
Exhibit 94: Fuji Systems Co. Ltd. - Product / Service
Exhibit 95: Fuji Systems Co. Ltd. - Key offerings
Exhibit 96: Integra Lifesciences Holdings Corp. - Overview
Exhibit 97: Integra Lifesciences Holdings Corp. - Business segments
Exhibit 98: Integra Lifesciences Holdings Corp. - Key news
Exhibit 99: Integra Lifesciences Holdings Corp. - Key offerings
Exhibit 100: Integra Lifesciences Holdings Corp. - Segment focus
10.7 Medtronic Plc
Exhibit 101: Medtronic Plc - Overview
Exhibit 102: Medtronic Plc - Business segments
Exhibit 103: Medtronic Plc - Key news
Exhibit 104: Medtronic Plc - Key offerings
Exhibit 105: Medtronic Plc - Segment focus
10.8 Natus Medical Inc.
Exhibit 106: Natus Medical Inc. - Overview
Exhibit 107: Natus Medical Inc. - Product / Service
Exhibit 108: Natus Medical Inc. - Key news
Exhibit 109: Natus Medical Inc. - Key offerings
10.9 Neuromedex GmbH
Exhibit 110: Neuromedex GmbH - Overview
Exhibit 111: Neuromedex GmbH - Product / Service
Exhibit 112: Neuromedex GmbH - Key offerings
10.10 Silmag
Exhibit 113: Silmag - Overview
Exhibit 114: Silmag - Product / Service
Exhibit 115: Silmag - Key offerings
10.11 Sophysa
Exhibit 116: Sophysa - Overview
Exhibit 117: Sophysa - Product / Service
Exhibit 118: Sophysa - Key offerings
10.12 Spiegelberg GmbH and Co. KG
Exhibit 119: Spiegelberg GmbH and Co. KG - Overview
Exhibit 120: Spiegelberg GmbH and Co. KG - Product / Service
Exhibit 121: Spiegelberg GmbH and Co. KG - Key offerings
11.1 Scope of the report
11.2 Inclusions and exclusions checklist
Exhibit 122: Inclusions checklist
Exhibit 123: Exclusions checklist
11.3 Currency conversion rates for US$
Exhibit 124: Currency conversion rates for US$
11.4 Research methodology
Exhibit 125: Research methodology
Exhibit 126: Validation techniques employed for market sizing
Exhibit 127: Information sources
11.5 List of abbreviations
Exhibit 128: List of abbreviations
About Technavio
Technavio is a leading global technology research and advisory company. Their research and analysis focus on emerging market trends and provide actionable insights to help businesses identify market opportunities and develop effective strategies to optimize their market positions.
With over 500 specialized analysts, Technavio's report library consists of more than 17,000 reports and counting, covering 800 technologies, spanning across 50 countries. Their client base consists of enterprises of all sizes, including more than 100 Fortune 500 companies. This growing client base relies on Technavio's comprehensive coverage, extensive research, and actionable market insights to identify opportunities in existing and potential markets and assess their competitive positions within changing market scenarios.
Contacts
Technavio Research
Jesse Maida
US: +1 844 364 1100
UK: +44 203 893 3200
Email: [email protected]
Website: www.technavio.com/
SOURCE Technavio
更多内容,请访问原始网站
文中所述内容并不反映新药情报库及其所属公司任何意见及观点,如有版权侵扰或错误之处,请及时联系我们,我们会在24小时内配合处理。
靶点
-药物
-热门报告


立即开始免费试用!
智慧芽新药情报库是智慧芽专为生命科学人士构建的基于AI的创新药情报平台,助您全方位提升您的研发与决策效率。
立即开始数据试用!
智慧芽新药库数据也通过智慧芽数据服务平台,以API或者数据包形式对外开放,助您更加充分利用智慧芽新药情报信息。