预约演示
更新于:2025-09-09
Repligen Corp.
更新于:2025-09-09
概览
标签
肿瘤
皮肤和肌肉骨骼疾病
生长因子
关联
1
项与 Repligen Corp. 相关的药物靶点- |
作用机制 血管生成抑制剂 |
在研机构 |
原研机构 |
在研适应症 |
最高研发阶段临床1/2期 |
首次获批国家/地区- |
首次获批日期- |
10
项与 Repligen Corp. 相关的临床试验NCT01371240
Evaluation of Efficiency of Secretin-Assisted Computed Tomography Scan and Secretin-Assisted Magnetic Resonance Imaging in Improving Pancreatic Enhancement and Tumor Conspicuity: Prospective Study
Accurate preoperative tumor detection and staging are fundamental for treating patients with pancreatic adenocarcinoma. Patients with unresectable tumors can benefit from being spared an extensive operation associated with substantial morbidity and mortality, cost, and pain. On the other hand, patients with localized disease, which is amenable to surgical removal, have the option of operation. Therefore, accurate staging of pancreatic cancer requires the detection of the tumor, and evaluation of its size, its relationship to major peri-pancreatic vascular structures and portal venous system, locoregional lymph nodes, and distant metastases. Multiple imaging techniques have been used to evaluate the pancreas. Although, at this point, no consensus exists as to the best staging algorithm, multidetector (MD) computed tomogrophy (CT) and Magnetic resonance imaging (MRI) provide sufficient information for the management of most patients.
Patients with a tumor larger than 3 cm are characterized as non-surgical. CT sensitivity in detecting small pancreatic tumors of less than 2 cm is low. Multiple methods have been suggested to increase the sensitivity of CT. The sensitivity of CT increases with using multidetector CT which now has an accuracy rate of about 95-97% for initial detection and approximating that of 100% for staging.
Secretin (a natural hormone produced by the duodenal mucosal cells) is known to increase blood flow to the pancreas. The principal use of secretin in imaging today is in exocrine function of the pancreas or morphological evaluation of the pancreatic duct under ultrasound or MRI. Theoretically, pancreatic contrast enhancement should also increase after secretin administration. This would imply that tumor conspicuity might also be increased if contrast enhancement of the normal pancreas increases. Secretin CT has been advocated by other centers to improve depiction of the ampulla and periampullary/duodenal diseases and to improve contrast enhancement. O'Connell et al, used secretin in patients suspected or with known pancreatic mass and concluded that administration of intravenous secretin leads to greater enhancement of the pancreas with greater tumor conspicuity, than imaging without secretin.
MRI of the pancreas has undergone a major change because it can provide noninvasive images of the pancreatic ducts and the parenchyma. MR cholangiopancreatography (MRCP) enables detection of anatomic variants such as pancreas divisum. Although contrast material-enhanced CT is still considered the gold standard in acute pancreatitis and for the detection of calcifications in chronic pancreatitis, MR imaging and secretin-enhanced MRCP are useful in evaluating pseudocysts and pancreatic disruption.
The role of MR is still debated in pancreatic neoplasms except the cystic lesions where MR imaging provides critical information regarding the lesion's content and a possible communication with the pancreatic ducts. Although some articles have shown that MRI was equivalent to CT in diagnosis and staging, others have shown the opposite. Nishiharu et al. found comparable tumor detection but a benefit with CT, notably for peripancreatic and vascular invasion. Comparing CT, echoendoscopy, and MRI, Soriano et al. demonstrated that CT showed the highest level of precision in primary tumor staging, local-regional staging, vascular invasion, distant metastases, Tumor, node, metastasis (TNM) staging, and tumor resectability. MRI retains its originality in imaging the parenchyma, the pancreatic and biliary ducts, and vascular structures; however, in many institutions, CT remains the reference imaging choice for diagnosing and staging pancreatic cancer. Other than CT's advantages for the tumor, its excellent spatial resolution also provides detailed reconstructions in all planes and arterial mapping and therefore makes it possible to search for surgical contraindications such as celiac trunk stenosis. MRI is still used today as a second-intention tool when there is doubt or when CT and echoendoscopy are not sufficiently conclusive; it is not currently recommended to use MRI in first-intention diagnosis of pancreatic cancer.
The aim of this pilot study is to determine whether the administration of intravenous secretin before contrast-enhanced CT and MRI improves pancreatic enhancement and pancreatic tumor conspicuity and to evaluate which technique is more appropriate for pancreatic tumor detection, staging and evaluation of resectability.
开始日期2011-06-01 |
申办/合作机构 |
NCT00812058
A Phase II Randomized, Double-Blind, Placebo-Controlled, Flexible-Dose Study to Assess the Safety, Tolerability and Efficacy of RG2417 (Uridine) in the Treatment of Bipolar I Depression
The purpose of this study is to test a new drug, RG2417, to see how the drug affects symptoms of bipolar I depression and to make sure it is safe in humans.
开始日期2008-11-01 |
申办/合作机构 |
NCT00660335
Phase III Study to Demonstrate the Efficacy and Safety of RG1068 (Synthetic Human Secretin)- Enhanced Magnetic Resonance Cholangiopancreatography (MRCP) in the Evaluation of Subjects With a History of Acute or Acute Recurrent Pancreatitis
The purpose of this study is to evaluate the safety and effectiveness of RG1068 (synthetic human secretin) with MRCP in subjects with abnormalities of the pancreas.
开始日期2008-03-01 |
申办/合作机构 |
100 项与 Repligen Corp. 相关的临床结果
登录后查看更多信息
0 项与 Repligen Corp. 相关的专利(医药)
登录后查看更多信息
135
项与 Repligen Corp. 相关的文献(医药)2024-01-01·Neuroscience Applied
Lithium treatment for affective disorders: Exploring the potential of salivary therapeutic monitoring
Article
作者: Buspavanich, Pichit ; Marcella Rietschel ; Völker, Maja P ; Bresele, Juliana ; Gerlach, Frank ; Schneider, Michael ; Granger, Douglas A ; Hauptmann, Michael ; Schummer, Fabian ; Parkin, Georgia M ; Gilles, Maria ; Findeisen, Peter ; Stamm, Thomas ; Müller, Anne ; Behr, Joachim ; Thomas, Elizabeth A ; Hartlep, Michael ; Schwesinger, Alexander ; Witt, Stephanie H ; Sirignano, Lea ; Graßhof, Tino ; Hummel, Nils ; Zolk, Oliver ; Pietzner, Anne ; Decker, Manfred ; Dukal, Helene ; Vonau, Winfried
Lithium is one of the most effective medications for treatment-resistant depression and bipolar disorder. However, lithium has a narrow therapeutic window: overdosing can lead to life-threatening lithium intoxication while underdosing results in a lack of desired therapeutic effects. Therefore, lithium treatment requires close monitoring with regular laboratory assessments of blood serum concentrations. An alternative method for monitoring lithium at home would increase the safety and empowerment of patients. In our project, we are investigating the potential of saliva as a readily accessible medium. We are exploring a) the best method for collecting and processing saliva, b) methods to measure salivary lithium levels, and c) the correlation between blood serum and saliva concentrations of lithium, and influencing factors; with the aim to develop a Point-of-care home testing device.
2024-01-01·Biotechnology and bioengineering
Accelerated and intensified manufacturing of an adenovirus‐vectored vaccine to enable rapid outbreak response
Article
作者: Doultsinos, Dimitrios ; Douglas, Alexander D ; Segireddy, Rameswara R ; Ahmad, Asma ; Li, Yuanyuan ; Scholze, Steffi ; Oliveira, Cathy ; Nestola, Piergiuseppe ; Berg, Adam ; Niemann, Julia ; Joe, Carina C D
Abstract:
The Coalition for Epidemic Preparedness Innovations' “100‐day moonshot” aspires to launch a new vaccine within 100 days of pathogen identification, followed by large‐scale vaccine availability within the “second hundred days.” Here, we describe work to optimize adenoviral vector manufacturing for rapid response, by minimizing time to clinical trial and first large‐scale supply, and maximizing output from the available manufacturing footprint. We describe a rapid virus seed expansion workflow that allows vaccine release to clinical trials within 60 days of antigen sequence identification, followed by vaccine release from globally distributed sites within a further 40 days. We also describe a perfusion‐based upstream production process, designed to maximize output while retaining simplicity and suitability for existing manufacturing facilities. This improves upstream volumetric productivity of ChAdOx1 nCoV‐19 by approximately fourfold and remains compatible with the existing downstream process, yielding drug substance sufficient for 10,000 doses from each liter of bioreactor capacity. This accelerated manufacturing process, along with other advantages such as thermal stability, supports the ongoing value of adenovirus‐vectored vaccines as a rapidly adaptable and deployable platform for emergency response.
2019-04-01·Journal of chromatography. A2区 · 化学
Packing quality, protein binding capacity and separation efficiency of pre-packed columns ranging from 1 mL laboratory to 57 L industrial scale
2区 · 化学
Article
作者: Berger, Eva ; Peyser, James ; Chan, Alan ; Schweiger, Susanne ; Gebski, Christine ; Jungbauer, Alois
Pre-packed chromatography columns are routinely used in downstream process development and scale-down studies. In recent years they have also been widely adopted for large scale, cGMP manufacturing of biopharmaceuticals. Despite columns being qualified at their point of manufacture before release for sale, the suitability of pre-packed chromatography columns for protein separations at different scales has not yet been demonstrated. In this study, we demonstrated that the performance results obtained with small scale columns (0.5 cm diameter × 5 cm length, 1 mL column volume) are scalable to production sized columns (60 cm diameter × 20 cm length, 57 L column volume). The columns were characterized with acetone and blue dextran pulses to determine the packing density and packed bed consistency. Chromatography performance was evaluated with breakthrough curves including capacity measurements and with separation of a ternary protein mixture (lysozyme, cytochrome C and RNase A) with a step gradient. The equilibrium binding capacity and dynamic binding capacity were equivalent for all columns. The step gradient separation of the ternary protein mixture displayed similar peak profiles when normalized in respect to column volume and the eluted protein pools had the same purities for all scales. Scalable performance of pre-packed columns is demonstrated but as with conventionally packed columns the influence of extra column volume and system configurations, especially buffer mixing, must be taken into account when comparing separations at different scales.
116
项与 Repligen Corp. 相关的新闻(医药)2025-07-31
WALTHAM, Mass., July 31, 2025 (GLOBE NEWSWIRE) -- Repligen Corporation (NASDAQ:RGEN), a life sciences company focused on bioprocessing technology leadership, today announced Novasign and Repligen have entered into a strategic partnership to develop and integrate Novasign’s machine learning and modeling workflow into Repligen filtration systems. As part of the partnership, Repligen will invest in Novasign to help scale and expand operations. Through this collaboration, Novasign’s unique modeling workflow will be integrated into Repligen’s tangential flow filtration (TFF) systems. This will not only enhance Repligen’s digitalization journey and strengthen its portfolio of process analytical technology (PAT)-enabled systems but also unlock the potential for future advanced AI modeling within Repligen platforms. The end goal is to streamline process development, enable real-time predictive control, and significantly reduce development timelines and costs through the deployment of digital twins. Novasign brings together deep expertise in bioprocessing, modeling, and software engineering to deliver AI-powered solutions across cultivation, harvest, filtration, and chromatography. The company’s flexible, multi-use models extract actionable insights from experimental data and can be readily applied to new modalities, products, and scales. The net result is smarter process development, enhanced monitoring and control, and a significant reduction in time, cost, and risk. Ralf Kuriyel, Senior Vice President, Research and Development at Repligen, said, “We are excited to partner with Novasign, a leader in bioprocessing modeling technology. Our partnership underscores Repligen’s dedication to advancing toward smart digital manufacturing. By integrating our automated manufacturing systems with smart sensors and Novasign’s digital twins capability, we will provide technology to accelerate process development and ensure a more efficient and reliable scale-up for our customers.” Mark Duerkop, Chief Executive Officer at Novasign, added, “The fusion of intelligent modeling workflows, PAT and smart devices will allow the industry to drastically reduce development costs while unlocking deeper process understanding. We’ve already laid the groundwork for this collaboration through earlier joint efforts with Repligen on its PAT technologies, and we’re proud to now take it to the next level with joint development. This strategic partnership represents a strong endorsement of Novasign’s innovation and long-term role in advancing bioprocess digitalization.” About NovasignFounded in 2019 as a spin-off from BOKU University, Novasign is headquartered in Vienna, Austria, and is rapidly becoming a central enabler of bioprocessing 4.0. The company accelerates bioprocess development through smart experimental workflows and an intuitive modeling platform. Its software transforms data from cultivation, harvest, filtration, and chromatography into extensible digital twins, enabling data-driven optimization for mAbs, ATMPs, enzymes, and cultured-food processes. By embedding advanced modeling directly into experimental workflows, Novasign shortens development timelines, reduces costs, and deepens process understanding. For more information, visit https://novasign.at. and follow us on LinkedIn. About Repligen CorporationRepligen Corporation is a global life sciences company that develops and commercializes highly innovative bioprocessing technologies and systems that enable efficiencies in the process of manufacturing biological drugs. We are “inspiring advances in bioprocessing” for the customers we serve; primarily biopharmaceutical drug developers and contract development and manufacturing organizations (CDMOs) worldwide. Our focus areas are Filtration and Fluid Management, Chromatography, Process Analytics and Proteins. Our corporate headquarters are located in Waltham, Massachusetts, and the majority of our manufacturing sites are in the U.S., with additional key sites in Estonia, France, Germany, Ireland, the Netherlands and Sweden. For more information, please visit www.repligen.com, and follow us on LinkedIn. Forward-Looking Statements This press release contains forward-looking statements, which are made pursuant to and in reliance upon the safe harbor provisions of federal securities laws, including the Private Securities Litigation Reform Act of 1995, Section 27A of the Securities Act of 1933, as amended, and Section 21E of the Securities Exchange Act of 1934, as amended. Any statements contained herein which do not describe historical facts, including, among others, any express or implied statements or guidance regarding current or future financial performance and position, including our 2025 financial guidance and related assumptions; expected demand in the markets in which we operate; expectations regarding the acquisition of 908 Devices’ bioprocessing portfolio; and the expected performance of our business and momentum across our portfolio, are based on management’s current expectations and beliefs and are forward-looking statements which involve risks and uncertainties that could cause actual results to differ materially from those discussed in such forward-looking statements. Such risks and uncertainties include, among others, our ability to successfully grow our bioprocessing business; our ability to manage through and predict headwinds; the risk that we have assumed that markets and franchises will improve and grow more than expected; our ability to achieve our 2025 financial guidance; our ability to develop and commercialize products and the market acceptance of our products; our ability to successfully integrate any acquired businesses and relevant personnel in a timely manner or at all, and to achieve the expected benefits of such acquisitions; that demand for our products could decline, which could adversely impact our future revenues, cash flows, results of operations and financial condition; our ability to compete with larger, better financed bioprocessing companies; risks around the Company’s effectiveness of disclosure controls and procedures and the effectiveness of our internal control over financial reporting; our compliance with all U.S. Food and Drug Administration and European Medicines Evaluation Agency regulations; our volatile stock price; the impact of tariffs on our business, and other risks and uncertainties detailed in Repligen’s filings with the U.S. Securities and Exchange Commission (the Commission), including our Annual Report on Form 10-K for the year ended December 31, 2024 and in subsequently filed reports with the Commission, including our Quarterly Reports on Form 10-Q and Current Reports on Form 8-K, and any subsequent filings made with the Commission, which are available at the Commission’s website at www.sec.gov. Actual results may differ materially from those Repligen contemplated by these forward-looking statements, which reflect management’s current views, expectations, and assumptions regarding the future of our business, future plans and strategies, projections, anticipated events and trends, the economy and other future conditions, and are based only on information currently available to us. Repligen cautions you not to place undue reliance on any forward-looking statements, which speak only as of the date they are made. Repligen disclaims any obligation to update or revise any such statements to reflect any change in expectations or in events, conditions or circumstances on which any such statements may be based, or that may affect the likelihood that actual results will differ from those set forth in the forward-looking statements.
Contact: Jacob JohnsonVP, Investor Relations(781) 419-0204investors@repligen.com Contact: Mark DuerkopChief Executive Officer0043 660 10 17 239management@novasign.at
2025-07-29
Repligen Reports Second Quarter 2025 Financial Results and Updates Full Year 2025 Financial Guidance
Revenue of $182 million, year-over-year increase of 15% as reported and 17% organic non-COVID growthOrders grew sequentially and greater than 20% year-over-yearIncreasing revenue guidance to range of $715 to $735 million, which represents 12.5% -15.5% year-over-year non-COVID organic growth WALTHAM, Mass., July 29, 2025 (GLOBE NEWSWIRE) -- Repligen Corporation (NASDAQ:RGEN), a life sciences company focused on bioprocessing technology leadership, today reported financial results for its second quarter of 2025, covering the three- and six- month periods ended June 30, 2025. Provided in this press release are financial performance highlights, updates to our guidance for the full year 2025 and access information for today’s webcast and conference call. Olivier Loeillot, President and Chief Executive Officer of Repligen said, “We had another outstanding quarter in Q2 with 17% organic non-COVID growth. We are very pleased with the momentum we see across the portfolio. This included strength in both consumables and capital equipment, while biopharma demand continues to perform very well. Orders grew over 20%, which represented the eighth quarter in a row of orders exceeding non-COVID revenue and the fifth quarter of sequential order growth. We believe this is a testament to our differentiated strategy, which resulted in 15% organic non-COVID growth in the first half of 2025. “As a result of this continued execution and our visibility into the second half of 2025, we are raising the midpoint of our organic growth guidance despite recent headwinds from new modalities.” Q2 2025 BUSINESS HIGHLIGHTS Broad-Based Revenue Strength. All franchises posted year-over-year growth. Consumables were up greater than 20% and capital equipment grew high-teens. CDMOs posted strong year-over-year growth, while biopharma revenue grew 20%. In addition, all geographies grew mid-teens.New products. Launched ProConnex® MixOne, a single use mixer based on Metenova’s mixing technology, which combines components from a number of our fluid management acquisitions into a best-in-class, single use technology.Sustainability. Published our 2024 Sustainability report “Perspectives on Progress”, highlighting the company’s progress across numerous environmental, social and governance (ESG) initiatives. FINANCIAL PERFORMANCE Q2 2025 Financial Performance (compared to prior year periods except as noted)All adjusted figures are non-GAAP and, except for earnings per share, are rounded to the nearest million, and are reconciled in the tables included later in this press release. Reported revenue was $182 million compared to $159 million, an increase of 15% as reported, 11% organic and 17% organic excluding COVID related revenue.GAAP gross profit was $91 million compared to $82 million. Adjusted gross profit was $93 million compared to $81 million.GAAP income from operations was $14 million, compared to $5 million. Adjusted income from operations was $22 million, compared to $20 million.GAAP net income was $15 million, compared to $6 million. Adjusted net income was $21 million compared to $22 million.GAAP earnings per share was $0.26 on a fully diluted basis, compared to $0.10. Adjusted earnings per share was $0.37 on a fully diluted basis, compared to $0.40. MARGIN SUMMARY GAAP MarginsQ2 2025Q2 20241H 20251H 2024Gross Margin50.0%51.3%51.7%50.7%Operating (EBIT) Margin7.6%3.4%5.8%3.0% Adjusted (non-GAAP) MarginsQ2 2025Q2 20241H 20251H 2024Gross Margin51.1%51.1%52.3%50.2%Operating (EBIT) Margin12.0%12.8%12.9%10.9%EBITDA Margin17.6%17.6%18.5%16.0% Cash, cash equivalents and short-term investments at June 30, 2025, were $709 million, compared to $757 million at December 31, 2024. FINANCIAL GUIDANCE FOR FULL YEAR 2025All Adjusted figures are non-GAAP Our financial guidance for the full year 2025 is based on expectations for our existing business. Our GAAP and Adjusted (non-GAAP) guidance excludes the impact of any potential or pending business acquisitions in 2025, and future fluctuations in foreign currency exchange rates. CURRENT GUIDANCE(at July 29, 2025)FY 2025GAAPAdjusted (non-GAAP)Total Reported Revenue$715M - $735M$715M - $735MReported Growth13% - 16%13% - 16%Organic Growth-10.5% - 13.5%Organic, Non-COVID GrowthNon-COVID Growth- -12.5% - 15.5%15% - 18%Gross Margin51.5% - 52.5%52% - 53%Income from Operations$51M - $56M$98M - $103MOperating Margin7% - 8%13.5% - 14.5%Other Income (Expense)$8.5M - $9.5M$22M - $23MAdjusted EBITDA Margin-19.5% - 20.5%Tax Rate on Pre-Tax Income20% - 21%22% - 23%Net Income$48M - $51.5M$93.5M - $97MEarnings Per Share - Diluted$0.85 - $0.92$1.65 - $1.72 Updated revenue guidance now reflects a 1% tailwind from foreign currency versus our prior assumption of a 1.5% headwind. This assumes a ~1% headwind from new modalities, which is more than offset by strength elsewhere in the portfolio. Guidance also incorporates a modest impact from tariff surcharges. Conference Call and Webcast Access Repligen will host a conference call and webcast today, July 29, 2025, at 8:30 a.m. ET, to discuss second quarter 2025 financial results, corporate developments and financial guidance for 2025. The conference call will be accessible by dialing toll-free (800) 715-9871 for domestic callers or (646) 307-1963 for international callers. No passcode is required for the live call. In addition, a webcast will be accessible via the Investor Relations section of the Company’s website. Both the conference call and webcast will be archived for a period following the live event. The replay dial-in numbers are (800) 770-2030 from the U.S. and (609) 800-9909 for international callers. Replay listeners must provide the passcode 7706699. About Repligen Corporation Repligen Corporation is a global life sciences company that develops and commercializes highly innovative bioprocessing technologies and systems that enable efficiencies in the process of manufacturing biological drugs. We are “inspiring advances in bioprocessing” for the customers we serve; primarily biopharmaceutical drug developers and contract development and manufacturing organizations (CDMOs) worldwide. Our focus areas are Filtration and Fluid Management, Chromatography, Process Analytics and Proteins. Our corporate headquarters are located in Waltham, Massachusetts, and the majority of our manufacturing sites are in the U.S., with additional key sites in Estonia, France, Germany, Ireland, the Netherlands and Sweden. For more information about the company see our website at www.repligen.com, and follow us on LinkedIn. Non-GAAP Measures of Financial Performance To supplement our financial statements, which are presented on the basis of U.S. generally accepted accounting principles (GAAP), the following Adjusted (non-GAAP) measures of financial performance are included in this release: organic non-COVID revenue and non-COVID revenue growth; organic revenue and organic revenue growth; adjusted cost of goods sold, adjusted gross profit and adjusted gross margin; adjusted R&D expense and adjusted SG&A expense; adjusted income from operations and adjusted operating margin; adjusted pre-tax income; adjusted net income; adjusted earnings per share (diluted); adjusted earnings before interest, taxes, depreciation and amortization (EBITDA), and adjusted EBITDA margin. The Company provides the impact of foreign currency translation, to enable determination of revenue growth rates at constant currency. To calculate the impact of foreign currency translation, the Company converts actual net sales from local currency to U.S. dollars using constant foreign currency exchange rates in the current and prior year periods. The Company’s non-GAAP financial results and/or non-GAAP guidance exclude the impact of: acquisition and integration costs; restructuring charges including the costs of severance and accelerated depreciation among other charges; inventory step-up costs and adjustments; incremental costs attributed to CEO transition; contingent consideration related to the Company’s acquisitions; intangible amortization costs; non-cash interest expense related to the accretion of the debt discount; amortization of debt issuance costs related to Company’s convertible debt; foreign currency impact of certain intercompany loans; and, the related impact on tax of non-GAAP charges. These costs are excluded because management believes that such expenses do not have a direct correlation to future business operations, nor do the resulting charges recorded accurately reflect the performance of our ongoing operations for the period in which such charges are recorded. NOTE:All reconciliations of above GAAP figures (reported or guidance) to adjusted (non-GAAP) figures are detailed in the tables included later in this press release. When analyzing the Company’s operating performance and guidance, investors should not consider non-GAAP measures as a substitute for the comparable financial measures prepared in accordance with GAAP. Forward-Looking Statements This press release contains forward-looking statements, which are made pursuant to and in reliance upon the safe harbor provisions of federal securities laws, including the Private Securities Litigation Reform Act of 1995, Section 27A of the Securities Act of 1933, as amended, and Section 21E of the Securities Exchange Act of 1934, as amended. Any statements contained herein which do not describe historical facts, including, among others, any express or implied statements or guidance regarding current or future financial performance and position, including our 2025 financial guidance and related assumptions; expected demand in the markets in which we operate; expectations regarding the acquisition of 908 Devices’ bioprocessing portfolio; and the expected performance of our business and momentum across our portfolio, are based on management’s current expectations and beliefs and are forward-looking statements which involve risks and uncertainties that could cause actual results to differ materially from those discussed in such forward-looking statements. Such risks and uncertainties include, among others, our ability to successfully grow our bioprocessing business; our ability to manage through and predict headwinds; the risk that we have assumed that markets and franchises will improve and grow as predicted; our ability to achieve our 2025 financial guidance; our ability to develop and commercialize products and the market acceptance of our products; our ability to successfully integrate any acquired businesses and relevant personnel in a timely manner or at all, and to achieve the expected benefits of such acquisitions; the risk that demand for our products could decline, which could adversely impact our future revenues, cash flows, results of operations and financial condition; our ability to compete with larger, better financed bioprocessing companies; risks around the Company’s effectiveness of disclosure controls and procedures and the effectiveness of our internal control over financial reporting; our compliance with all U.S. Food and Drug Administration and European Medicines Evaluation Agency regulations; our volatile stock price; the impact of tariffs on our business, and other risks and uncertainties detailed in Repligen’s filings with the U.S. Securities and Exchange Commission (the Commission), including our Annual Report on Form 10-K for the year ended December 31, 2024 and in subsequently filed reports with the Commission, including our Quarterly Reports on Form 10-Q and Current Reports on Form 8-K, and any subsequent filings made with the Commission, which are available at the Commission’s website at www.sec.gov. Actual results may differ materially from those Repligen contemplated by these forward-looking statements, which reflect management’s current views, expectations, and assumptions regarding the future of our business, future plans and strategies, projections, anticipated events and trends, the economy and other future conditions, and are based only on information currently available to us. Repligen cautions you not to place undue reliance on any forward-looking statements, which speak only as of the date they are made. Repligen disclaims any obligation to update or revise any such statements to reflect any change in expectations or in events, conditions or circumstances on which any such statements may be based, or that may affect the likelihood that actual results will differ from those set forth in the forward-looking statements. Repligen Contact: Jacob JohnsonVP, Investor Relations(781) 419-0204investors@repligen.com REPLIGEN CORPORATION CONDENSED CONSOLIDATED STATEMENTS OF OPERATIONS (Unaudited, amounts in thousands, except share and per share data)
Three Months EndedJune 30, Six Months EndedJune 30, 2025 2024 2025 2024 Revenue:
Product revenue $182,329 $158,804 $351,466 $311,950 Royalty and other revenue 37 35 72 71 Total revenue 182,366 158,839 351,538 312,021 Costs and expenses:
Cost of goods sold 91,224 77,314 169,639 153,705 Research and development 13,958 10,575 26,882 21,813 Selling, general and administrative 71,227 65,481 142,482 127,284 Change in fair value of contingent consideration (7,939) — (7,939) — Total costs and operating expenses 168,470 153,370 331,064 302,802 Income from operations 13,896 5,469 20,474 9,219 Investment income 6,585 9,411 13,899 18,404 Interest expense (5,354) (5,118) (10,604) (10,147) Amortization of debt issuance costs (414) (520) (827) (1,003) Other income (expenses) 3,502 (215) 3,216 (3,751) Income before income taxes 18,215 9,027 26,158 12,722 Income tax provision 3,349 3,314 5,462 3,713 Net income $14,866 $5,713 $20,696 $9,009 Earnings per share:
Basic $0.26 $0.10 $0.37 $0.16 Diluted $0.26 $0.10 $0.37 $0.16 Weighted average shares outstanding:
Basic 56,234,399 55,884,250 56,178,879 55,837,770 Diluted 56,510,323 56,434,065 56,509,198 56,476,771
Balance Sheet Data: June 30,2025 December 31,2024
Cash and cash equivalents $708,855 $757,355
Working capital 933,853 939,254
Convertible Senior Notes 533,725 525,567
REPLIGEN CORPORATION RECONCILIATIONS OF GAAP to NON-GAAP FINANCIAL MEASURES (Unaudited, amounts in thousands, except percentage and earnings per share data) In all tables below, totals may not add due to rounding
Reconciliation of Total Revenue (GAAP) Growth to Organic Non-COVID Revenue Growth (Non-GAAP)
Three Months Ended June 30, Six Months Ended June 30, 2025 2024 2025 2024TOTAL REPORTED REVENUE (GAAP) GROWTH 15% 0% 13% (4)%Acquisition revenue (2)% (3)% (1)% (3)%Currency exchange (2)% 1% 0% 1%ORGANIC REVENUE GROWTH (NON-GAAP) 11% (2)% 11% (7)%COVID revenue 6% (4)% 4% (2)%ORGANIC NON-COVID REVENUE GROWTH (NON-GAAP) 17% (7)% 15% (8)%
REPLIGEN CORPORATIONRECONCILIATIONS OF GAAP to NON-GAAP FINANCIAL MEASURES (Unaudited, amounts in thousands, except percentage and earnings per share data) In all tables below, totals may not add due to rounding
Reconciliation of Income from Operations (GAAP) to Adjusted Income from Operations (Non-GAAP)
Three Months Ended June 30, Six Months Ended June 30, 2025 2024 2025 2024 INCOME FROM OPERATIONS (GAAP) $13,896 $5,469 $20,474 $9,219 ADJUSTMENTS TO INCOME FROM OPERATIONS (GAAP):
Acquisition and integration costs 4,282 1,323 10,315 3,078 Restructuring activities and other related charges(1) 789 (56) 1,878 (640) Incremental costs attributed to CEO transition(2) — 4,967 — 4,967 Intangible amortization 10,204 8,640 19,325 17,356 Contingent Consideration (7,939) — (7,939) — Inventory step-up charges 577 — 577 — Other(4) 102 — 686 — ADJUSTED INCOME FROM OPERATIONS (NON-GAAP) $21,911 $20,343 $45,316 $33,980 OPERATING (EBIT) MARGIN 7.6% 3.4% 5.8% 3.0% ADJUSTED OPERATING (EBIT) MARGIN 12.0% 12.8% 12.9% 10.9%
Reconciliation of Net Income (GAAP) to Adjusted Net Income (Non-GAAP)
Three Months Ended June 30, Six Months Ended June 30, 2025 2024 2025 2024
NET INCOME (GAAP) $14,866 $5,713 $20,696 $9,009 ADJUSTMENTS TO NET INCOME (GAAP):
Acquisition and integration costs 4,282 1,323 10,315 3,078 Restructuring activities and other related charges(1) 789 (56) 1,878 (640) Incremental costs attributed to CEO transition(2) — 4,967 — 4,967 Intangible amortization 10,204 8,640 19,325 17,356 Contingent Consideration (11,053) — (11,053) — Inventory step-up charges 577 — 577 — Non-cash interest expense 3,827 3,536 7,574 7,000 Foreign currency impact of certain intercompany loans (3) — (342) — 3,445 Amortization of debt issuance costs 414 520 827 1,003 Other(4) 102 — 686 — Tax effect of non-GAAP charges (2,853) (1,894) (7,429) (5,584) ADJUSTED NET INCOME (NON-GAAP) $21,155 $22,407 $43,396 $39,634
Reconciliation of Earnings Per Share (GAAP) to Adjusted Earnings Per Share (Non-GAAP)
Three Months Ended June 30, Six Months Ended June 30, 2025 2024 2025 2024 EARNINGS PER SHARE (GAAP) - DILUTED $0.26 $0.10 $0.37 $0.16 ADJUSTMENTS TO EARNINGS PER SHARE (GAAP) - DILUTED:
Acquisition and integration costs 0.08 0.02 0.18 0.05 Restructuring activities and other related charges(1) 0.01 (0.00) 0.03 (0.01) Incremental costs attributed to CEO transition(2) — 0.09 — 0.09 Intangible amortization 0.18 0.15 0.34 0.31 Contingent Consideration (0.20) — (0.20) — Inventory step-up charges 0.01 — 0.01 — Non-cash interest expense 0.07 0.06 0.13 0.12 Foreign currency impact of certain intercompany loans (3) — (0.01) — 0.06 Amortization of debt issuance costs 0.01 0.01 0.01 0.02 Other(4) 0.00 — 0.01 — Tax effect of non-GAAP charges (0.05) (0.03) (0.13) (0.10) ADJUSTED EARNINGS PER SHARE (NON-GAAP) - DILUTED $0.37 $0.40 $0.77 $0.70
Reconciliation of Net Income (GAAP) to Adjusted EBITDA (Non-GAAP)
Three Months Ended June 30, Six Months Ended June 30, 2025 2024 2025 2024
NET INCOME (GAAP) $14,866 $5,713 $20,696 $9,009 ADJUSTMENTS:
Investment income (6,585) (9,411) (13,899) (18,404) Interest expense 5,354 5,118 10,604 10,147 Amortization of debt issuance costs 414 520 827 1,003 Income tax provision 3,349 3,314 5,462 3,713 Depreciation 9,850 8,308 19,405 16,472 Intangible amortization(5) 10,231 8,549 19,380 17,176 EBITDA (NON-GAAP) 37,479 22,111 62,475 39,116 OTHER ADJUSTMENTS:
Acquisition and integration costs 4,282 1,323 10,315 3,078 Restructuring activities and other related charges(1)(6) 789 (56) 1,878 (640) Incremental costs attributed to CEO transition(2) — 4,967 — 4,967 Contingent Consideration (11,053) — (11,053) — Inventory step-up charges 577 — 577 — Foreign currency impact of certain intercompany loans (3) — (342) — 3,445 Other(4) 102 — 686 — ADJUSTED EBITDA (NON-GAAP) $32,176 $28,003 $64,878 $49,966 ADJUSTED EBITDA MARGIN (NON-GAAP) 17.6% 17.6% 18.5% 16.0%
Reconciliation of Cost of Goods Sold (GAAP) to Adjusted Cost Goods Sold (Non-GAAP)
Three Months EndedJune 30, Six Months Ended June 30, 2025 2024 2025 2024 COST OF GOODS SOLD (GAAP) $91,224 $77,314 $169,639 $153,705 ADJUSTMENT TO COST OF GOODS SOLD (GAAP):
Acquisition and integration costs (739) (133) (842) (199) Restructuring activities and other related charges(1) (480) 514 (210) 1,962 Intangible amortization (280) — (467) — Inventory step-up charges (577) — (577) — ADJUSTED COST OF GOODS SOLD (NON-GAAP) $89,148 $77,695 $167,543 $155,468 GROSS MARGIN (GAAP) 50.0% 51.3% 51.7% 50.7% ADJUSTED GROSS MARGIN (NON-GAAP) 51.1% 51.1% 52.3% 50.2%
Reconciliation of R&D Expense (GAAP) to Adjusted R&D Expense (Non-GAAP)
Three Months Ended June 30, Six Months Ended June 30, 2025 2024 2025 2024 R&D EXPENSE (GAAP) $13,958 $10,575 $26,882 $21,813 ADJUSTMENT TO R&D EXPENSE (GAAP):
Acquisition and integration costs (693) (63) (1,113) (116) Restructuring activities and other related charges(1) 12 (284) (798) (449) Intangible amortization (535) — (892) — ADJUSTED R&D EXPENSE (NON-GAAP) $12,742 $10,228 $24,079 $21,248
Reconciliation of SG&A Expense (GAAP) to Adjusted SG&A Expense (Non-GAAP)
Three Months Ended June 30, Six Months Ended June 30, 2025 2024 2025 2024 SG&A EXPENSE (GAAP) $71,227 $65,481 $142,482 $127,284 ADJUSTMENTS TO SG&A EXPENSE (GAAP):
Acquisition and integration costs (2,850) (1,127) (8,360) (2,763) Restructuring activities and other related charges(1) (321) (174) (870) (873) Incremental costs attributed to CEO transition(2) — (4,967) — (4,967) Intangible amortization (9,389) (8,640) (17,966) (17,356) Other(4) (102) — (686) — ADJUSTED SG&A EXPENSE (NON-GAAP) $58,565 $50,573 $114,600 $101,325
Reconciliation of Net Income (GAAP) Guidance to Adjusted Earnings Per Share (Non-GAAP) Guidance
Year Ending December 31, 2025 Low End High EndGUIDANCE ON NET INCOME (GAAP) $48,000 $51,500 ADJUSTMENTS TO GUIDANCE ON NET INCOME (GAAP): Inventory Step-Up Costs and Adjustments 577 577 Acquisition and integration costs 12,677 12,677 Restructuring activities and other related charges(1) 2,345 2,345 Contingent Consideration (11,053) (11,053)Anticipated pre-tax amortization of acquisition-related intangible assets 38,808 38,808 Non-cash Interest Expense 14,826 14,826 Amortization of debt issuance costs 1,649 1,649 Tax effect of non-GAAP charges (15,004) (15,004)Other(4) 686 686 Guidance rounding adjustment (11) (11)GUIDANCE ON ADJUSTED NET INCOME (NON-GAAP) $93,500 $97,000
Reconciliation of Earnings Per Share (GAAP) Guidance to Adjusted Earnings Per Share (Non-GAAP) Guidance
Year Ending December 31, 2025 Low End High EndGUIDANCE ON EARNINGS PER SHARE (GAAP) - DILUTED $0.85 $0.92 ADJUSTMENTS TO GUIDANCE ON EARNINGS PER SHARE (GAAP) - DILUTED: Inventory Step-Up Costs and Adjustments 0.01 0.01 Acquisition and integration costs 0.22 0.22 Restructuring activities and other related charges(1) 0.04 0.04 Contingent Consideration (0.20) (0.20)Anticipated pre-tax amortization of acquisition-related intangible assets 0.69 0.69 Non-cash Interest Expense 0.26 0.26 Amortization of debt issuance costs 0.03 0.03 Tax effect of non-GAAP charges (0.27) (0.27)Other(4) 0.01 0.01 Guidance rounding adjustment (0.00) (0.00)GUIDANCE ON ADJUSTED EARNINGS PER SHARE (NON-GAAP) - DILUTED $1.65 $1.72
FOOTNOTES FOR ALL TABLES ABOVE (amounts in thousands): (1) In July 2023, we began restructuring activities to simplify and streamline our organization and strengthen the overall effectiveness of our operations. The Company continued further restructuring activities during 2025 including severance, employee-related and facility exit costs. Cost of goods sold includes the benefit received from the sale of inventory that had previously been reserved as part of the restructuring plan of $1,409 and $1,028 for the three months ended June 30, 2025 and 2024, respectively, and $2,293 and $3,035 for the six months ended June 30, 2025 and 2024, respectively. (2) Includes $4,967 of incremental stock compensation expense recorded during the three and six months ended June 30, 2024 attributable to the transition of the Company’s Chief Executive Officer (“CEO”) to Executive Chair of the Board announced by the Company on June 12, 2024. The incremental stock compensation expense was the result of the modification of the unvested equity awards held by the CEO immediately prior to the modification. This resulted in the revalue of his unvested awards and a change in his remaining requisite service period due to his change in duties upon transitioning to Executive Chair of the Board. (3) During the three and six months ended June 30, 2025 we recorded foreign currency adjustments on certain intercompany loans of ($342) and $3,445 respectively. The impact was recorded to the Other (expenses) income, net line item within the Condensed Consolidated Statements of Operations. (4) Includes one-time events relating to a cybersecurity incident, net of insurance, and costs associated with the restatement of previously issued financial statements. (5) Includes amortization of milestone payments in accordance with GAAP of $28 for the three months ended June 30, 2025 and 2024, and $55 for the six months ended June 30, 2025 and 2024. (6) Excludes $19 of accelerated depreciation related to the restructuring plan for the six months ended June 30, 2024. This amount is included in the depreciation line item of this table for that period.
财报
2025-07-07
AUSTIN, Texas--(BUSINESS WIRE)--ImmunoPrecise Antibodies Ltd. (NASDAQ: IPA) (“IPA” or the “Company”), an AI-powered biotherapeutics company, today announced the appointment of Jon Lieber to its Board of Directors, effective immediately.
Jon brings the rare and highly valuable combination of Nasdaq board governance and senior executive experience—critical as we navigate commercialization and strategic growth.
Mr. Lieber brings over 30 years of financial and strategic leadership across the biotechnology and life sciences sectors, with deep expertise in capital markets, investor relations, and corporate development. He currently serves as Chief Financial Officer at Rallybio, a clinical-stage biotechnology company developing therapies for severe and rare diseases. He also brings valuable experience in Nasdaq governance, having served as both a senior executive and board member of publicly traded companies.
“We are pleased to welcome Jon to IPA’s Board of Directors during this transformative period for the Company,” said Dr. Jennifer Bath, CEO of ImmunoPrecise. “Jon brings the rare and highly valuable combination of Nasdaq board governance and senior executive experience—critical as we navigate commercialization and strategic growth. His deep understanding of capital markets and proven success guiding innovation-driven companies aligns well with our strategy to expand adoption of our LENSai™ and HYFT® platforms, and to position IPA at the forefront of AI-powered drug discovery.”
Prior to Rallybio, Mr. Lieber was CFO at Applied Genetic Technologies Corporation (AGTC), a publicly traded gene therapy company, where he led all capital-raising efforts and oversaw finance, human resources, investor relations, and IT. He has also held senior leadership roles at Danforth Advisors, Histogenics, Repligen, Xcellerex (acquired by GE Healthcare), and Altus Pharmaceuticals. Earlier in his career, he worked in investment banking at Salomon Brothers / Salomon Smith Barney and SG Cowen.
Mr. Lieber currently serves on the Board of Directors of Salarius Pharmaceuticals, where he is a member of both the Audit Committee and the Nominating and Governance Committee, further underscoring his depth of experience in Nasdaq board governance.
“I’m excited to join IPA’s Board at such a pivotal time,” said Mr. Lieber. “The Company’s ability to integrate in silico discovery with translational biology sets it apart in a rapidly evolving biotherapeutics landscape. I look forward to supporting IPA’s continued momentum and strategic execution.”
About ImmunoPrecise Antibodies Ltd.
ImmunoPrecise (NASDAQ: IPA) is a global leader in AI-powered biotherapeutic discovery and development. Its proprietary HYFT technology and LENSai™ platform enable first-principles-based drug design, delivering validated therapeutic candidates across modalities and therapeutic areas. IPA partners with 19 of the top 20 pharmaceutical companies and is advancing next-generation biologics through data-driven, human-relevant models.
Forward-Looking Statements
This press release contains forward-looking statements within the meaning of applicable United States and Canadian securities laws. Forward-looking statements are often identified by words such as “expects,” “intends,” “plans,” “anticipates,” “believes,” or similar expressions, or by statements that certain actions, events, or results “may,” “will,” “could,” or “might” occur or be achieved. These statements include, but are not limited to, statements regarding the anticipated contributions of Mr. Lieber to the Company’s board and strategic direction, the Company’s growth trajectory, and its ability to execute on scientific, commercial, and capital markets initiatives.
Forward-looking statements are based on management’s current expectations, assumptions, and projections about future events. Actual results may differ materially from those expressed or implied due to a variety of factors, many of which are beyond the Company’s control. These factors include, but are not limited to, changes in leadership dynamics, evolving business strategies, market conditions, regulatory developments, scientific and technological advancements, and other risks related to the Company’s operations and industry.
Forward-looking statements involve known and unknown risks, uncertainties, and other factors that could cause actual results, performance, or achievements to differ materially from those expressed or implied herein. Additional information regarding risks and uncertainties is included in the Company’s Annual Report on Form 20-F, as amended, for the year ended April 30, 2024 (available on the Company’s SEDAR+ profile at www.sedarplus.ca and EDGAR profile at www.sec.gov/edgar). Should any of these risks materialize actual results could vary significantly from those currently anticipated.
Readers are cautioned not to place undue reliance on these forward-looking statements. Except as required by law, the Company undertakes no obligation to update or revise forward-looking statements to reflect subsequent events or circumstances.
高管变更
100 项与 Repligen Corp. 相关的药物交易
登录后查看更多信息
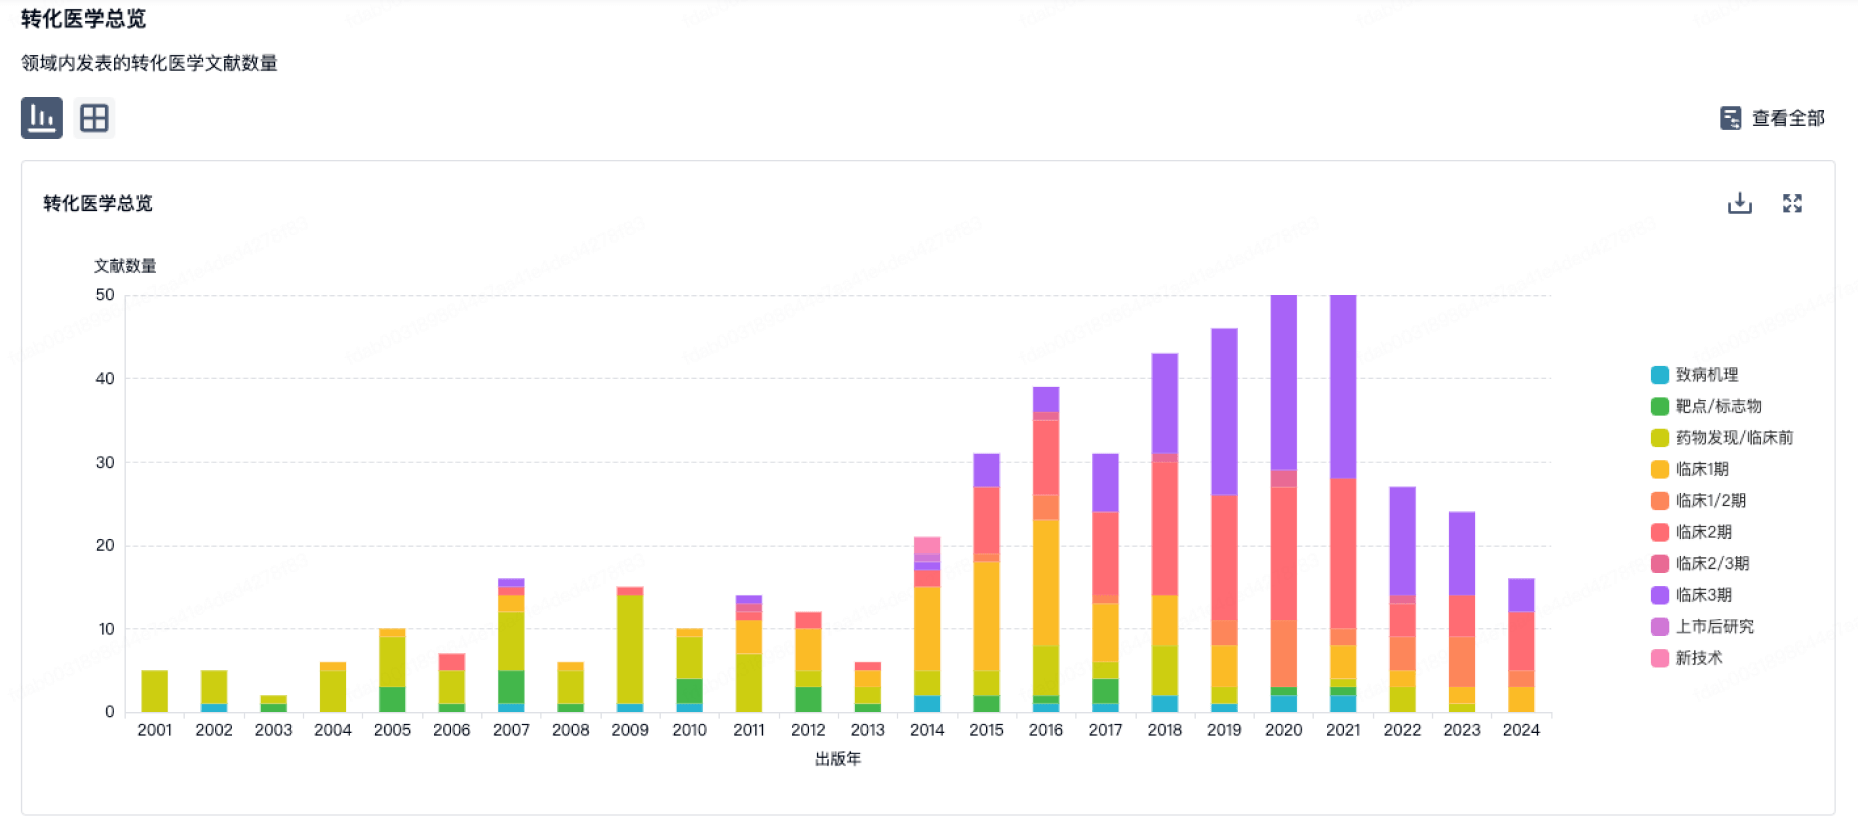
100 项与 Repligen Corp. 相关的转化医学
登录后查看更多信息
组织架构
使用我们的机构树数据加速您的研究。
登录
或
管线布局
2025年11月04日管线快照
管线布局中药物为当前组织机构及其子机构作为药物机构进行统计,早期临床1期并入临床1期,临床1/2期并入临床2期,临床2/3期并入临床3期
临床2期
1
14
其他
登录后查看更多信息
当前项目
| 药物(靶点) | 适应症 | 全球最高研发状态 |
|---|---|---|
Platelet factor 4(Repligen Corp.) | 胶质瘤 更多 | 终止 |
胰泌素 ( SCTR ) | 自闭症 更多 | 终止 |
白细胞介素-8受体(Repligen Corp.) | 哮喘 更多 | 终止 |
尿苷三乙酸酯 ( DPD ) | 遗传性线粒体呼吸链疾病 更多 | 终止 |
RG-8803 ( EGF x aFGF ) | 肿瘤 更多 | 终止 |
登录后查看更多信息
药物交易
使用我们的药物交易数据加速您的研究。
登录
或
转化医学
使用我们的转化医学数据加速您的研究。
登录
或
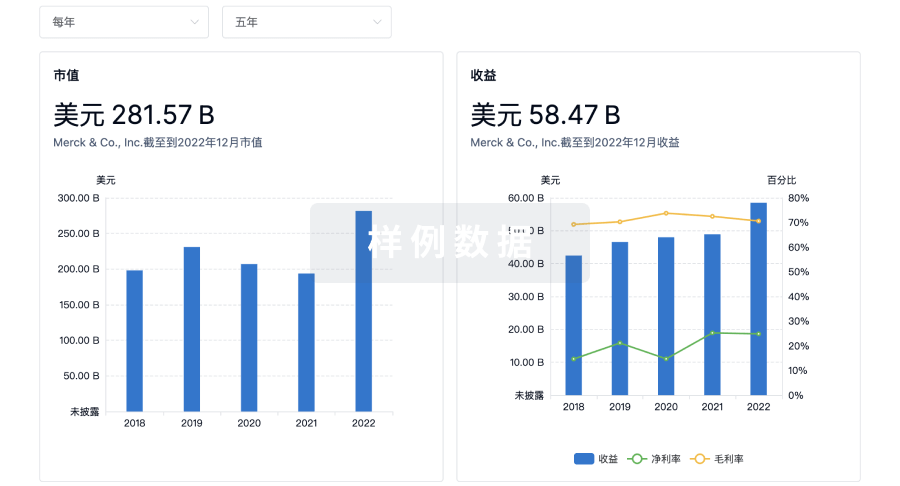
营收
使用 Synapse 探索超过 36 万个组织的财务状况。
登录
或
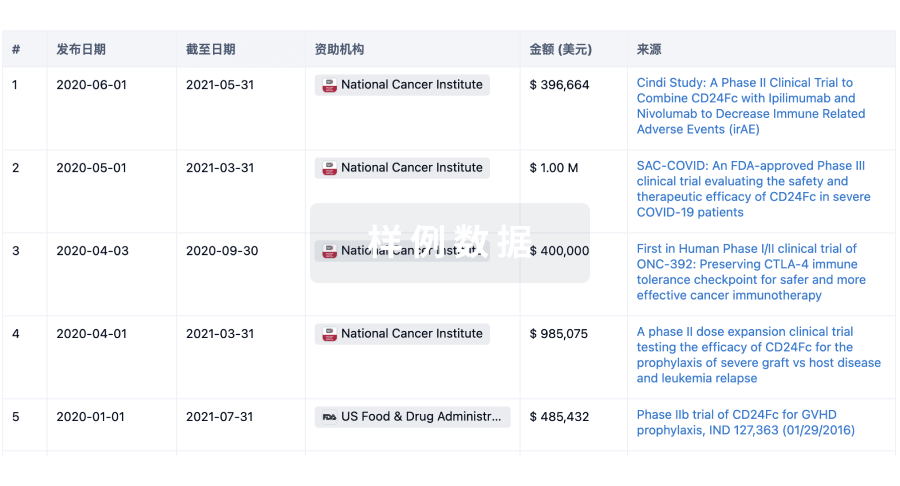
科研基金(NIH)
访问超过 200 万项资助和基金信息,以提升您的研究之旅。
登录
或
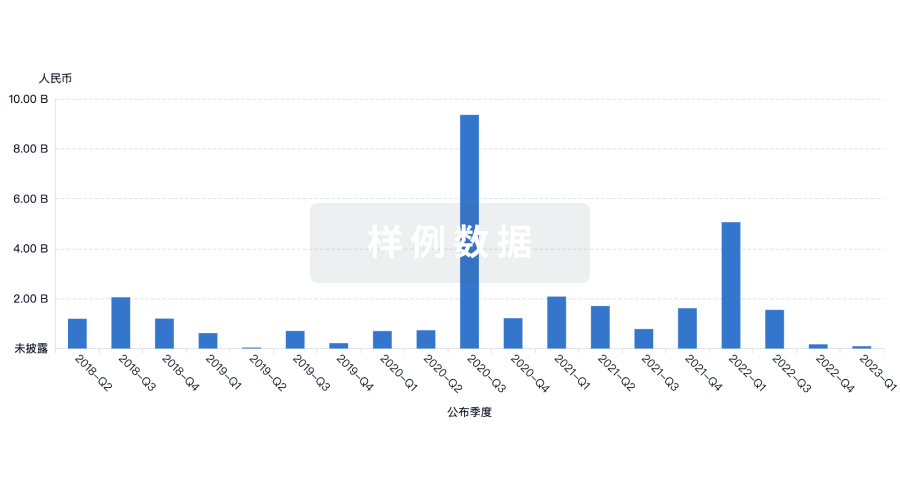
投资
深入了解从初创企业到成熟企业的最新公司投资动态。
登录
或
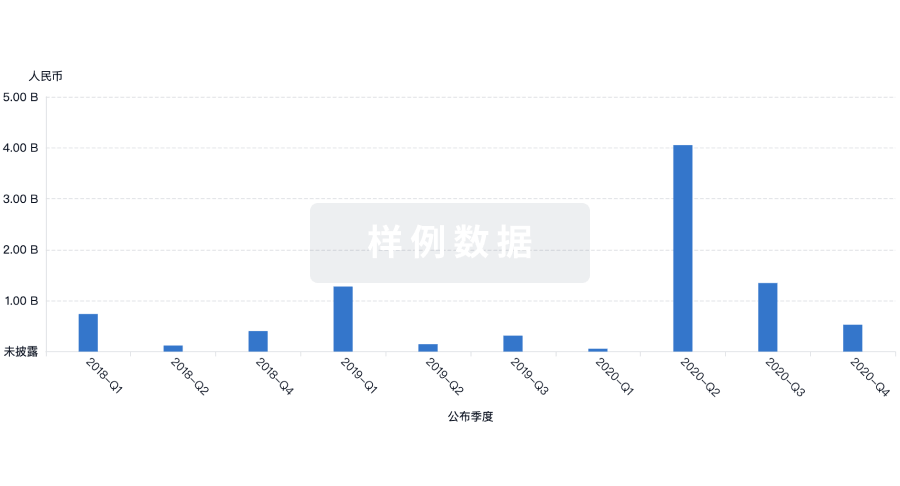
融资
发掘融资趋势以验证和推进您的投资机会。
登录
或
生物医药百科问答
全新生物医药AI Agent 覆盖科研全链路,让突破性发现快人一步
立即开始免费试用!
智慧芽新药情报库是智慧芽专为生命科学人士构建的基于AI的创新药情报平台,助您全方位提升您的研发与决策效率。
立即开始数据试用!
智慧芽新药库数据也通过智慧芽数据服务平台,以API或者数据包形式对外开放,助您更加充分利用智慧芽新药情报信息。
生物序列数据库
生物药研发创新
免费使用
化学结构数据库
小分子化药研发创新
免费使用
