预约演示
更新于:2025-05-07
Insulin lispro protamine biosimilar(Gan & Lee Pharmaceuticals Co., Ltd.)
精蛋白锌重组赖脯胰岛素生物类似药 (25R) (甘李药业)
更新于:2025-05-07
概要
基本信息
原研机构 |
在研机构 |
非在研机构- |
权益机构- |
最高研发阶段批准上市 |
首次获批日期 中国 (2014-05-09), |
最高研发阶段(中国)批准上市 |
特殊审评- |
登录后查看时间轴
结构/序列
Sequence Code 4857
当前序列信息引自: *****
Sequence Code 31946
当前序列信息引自: *****
关联
1
项与 精蛋白锌重组赖脯胰岛素生物类似药 (25R) (甘李药业) 相关的临床试验CTR20180887
单中心、随机、开放、以进口同类产品(优泌乐50)为交叉对照,评价速秀霖50对健康受试者的生物等效和安全性
100 项与 精蛋白锌重组赖脯胰岛素生物类似药 (25R) (甘李药业) 相关的临床结果
登录后查看更多信息
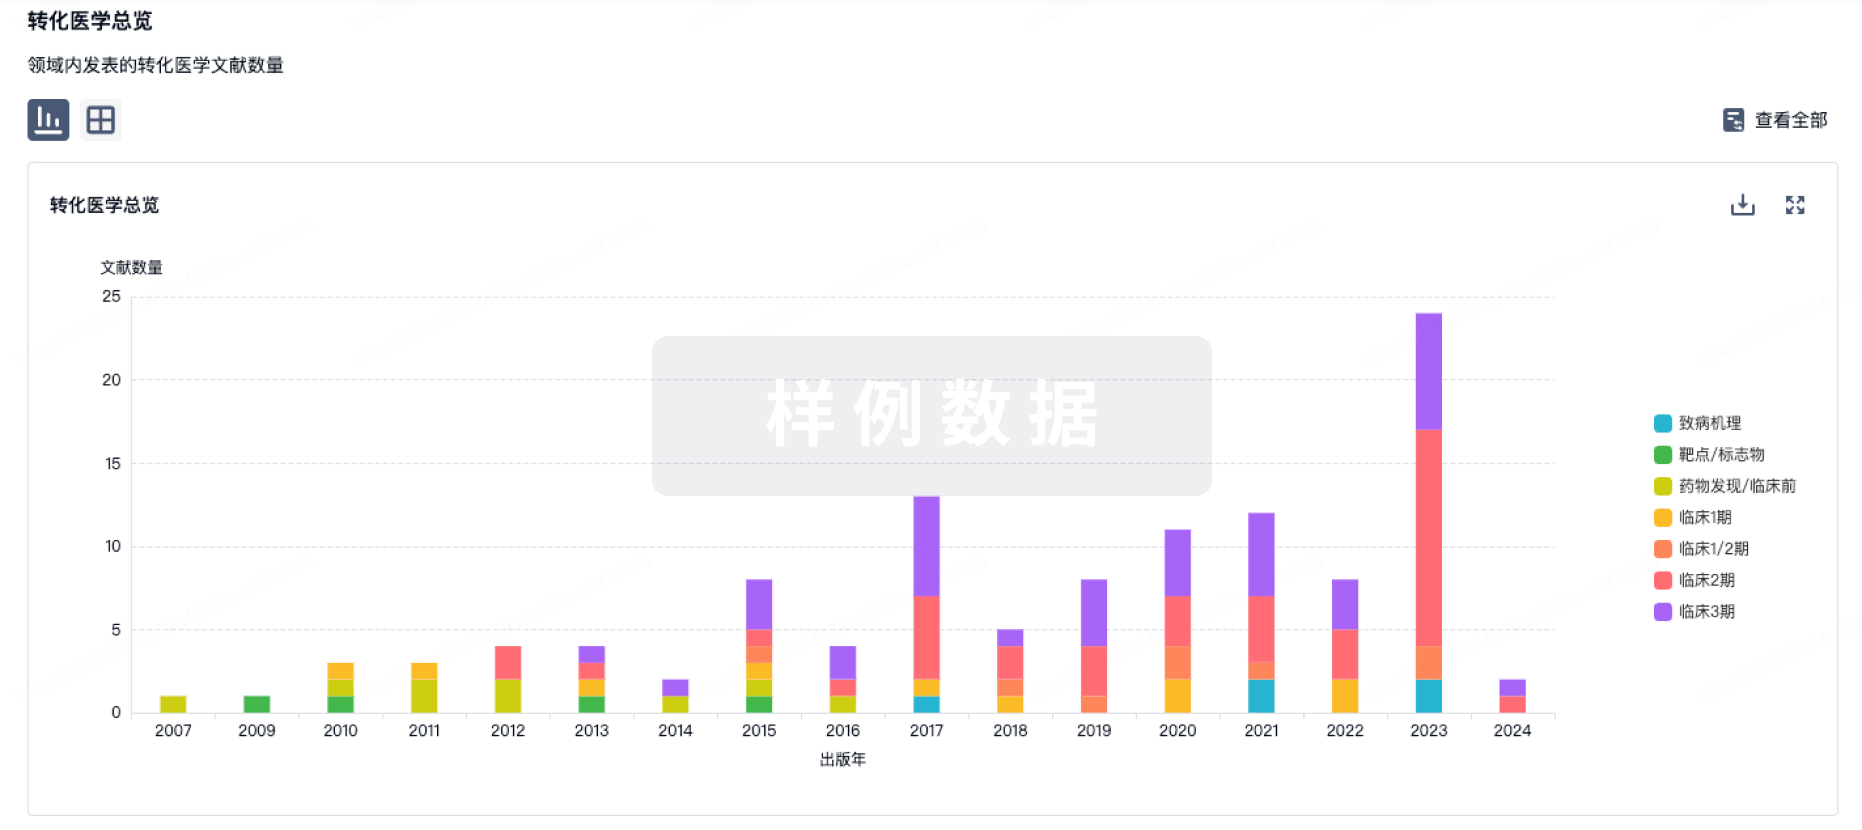
100 项与 精蛋白锌重组赖脯胰岛素生物类似药 (25R) (甘李药业) 相关的转化医学
登录后查看更多信息
100 项与 精蛋白锌重组赖脯胰岛素生物类似药 (25R) (甘李药业) 相关的专利(医药)
登录后查看更多信息
1
项与 精蛋白锌重组赖脯胰岛素生物类似药 (25R) (甘李药业) 相关的文献(医药)1999-03-01Clinical Therapeutics4区 · 医学
Improved postprandial blood glucose control and reduced nocturnal hypoglycemia during treatment with two novel insulin lispro-protamine formulations, insulin lispro Mix25 and insulin lispro Mix50
4区 · 医学
Article
作者: Gerber, P. ; Meincke, G. ; Hucbinger, A. ; Nattrass, M. ; Tamas, G. ; Sun, Bin ; Gaillarad, R. ; Breed, J. G. S. ; Trautmann, Michael ; Zick, R. ; Arora, Vipin ; Haslbeck, M. ; Roehrig, I. A. ; Jermendy, G. ; Vandorfy, G. ; Meissner, H. P. ; Holleman, F. ; Franken, A. A. M. ; Roach, Paris ; Lendroth, F. ; Matthews, D. ; Gale, E. ; Anderson, James H. Jr. ; Vora, J. ; Hoekstra, J. B. L.
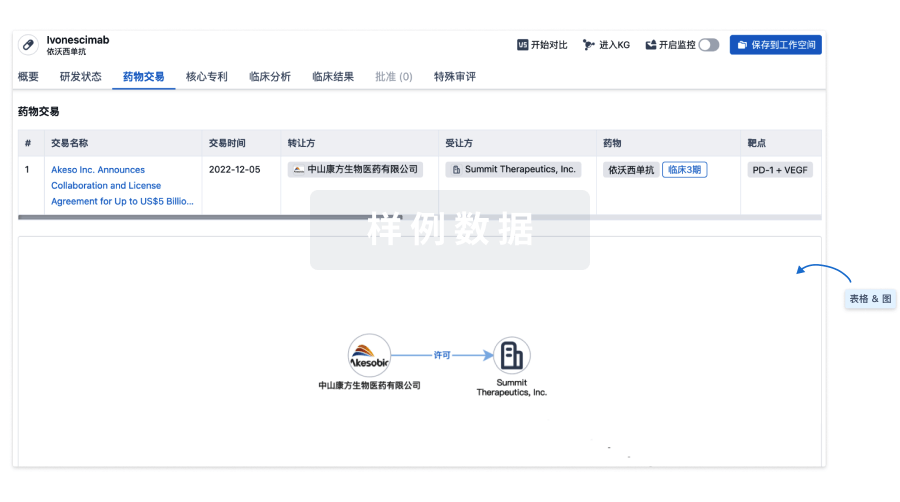
100 项与 精蛋白锌重组赖脯胰岛素生物类似药 (25R) (甘李药业) 相关的药物交易
登录后查看更多信息
研发状态
10 条最早获批的记录, 后查看更多信息
登录
| 适应症 | 国家/地区 | 公司 | 日期 |
|---|---|---|---|
| 糖尿病 | 中国 | 2014-05-09 |
登录后查看更多信息
临床结果
临床结果
适应症
分期
评价
查看全部结果
登录后查看更多信息
转化医学
使用我们的转化医学数据加速您的研究。
登录
或
药物交易
使用我们的药物交易数据加速您的研究。
登录
或
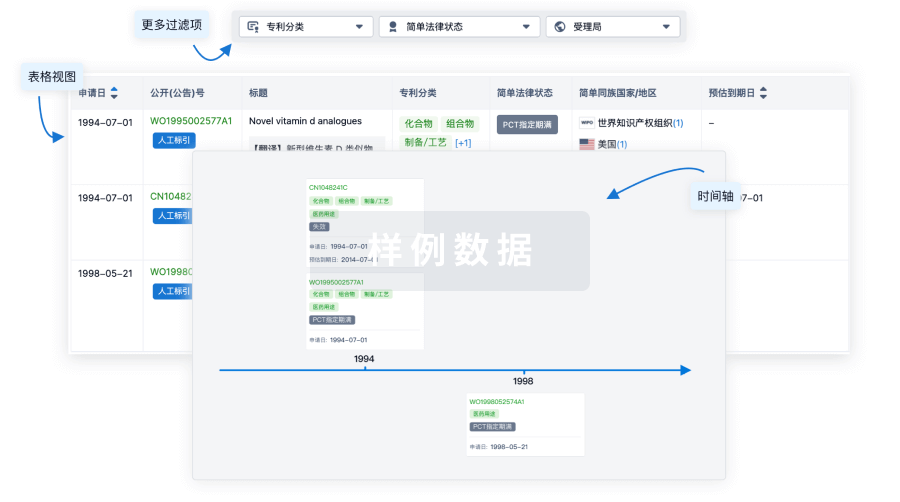
核心专利
使用我们的核心专利数据促进您的研究。
登录
或
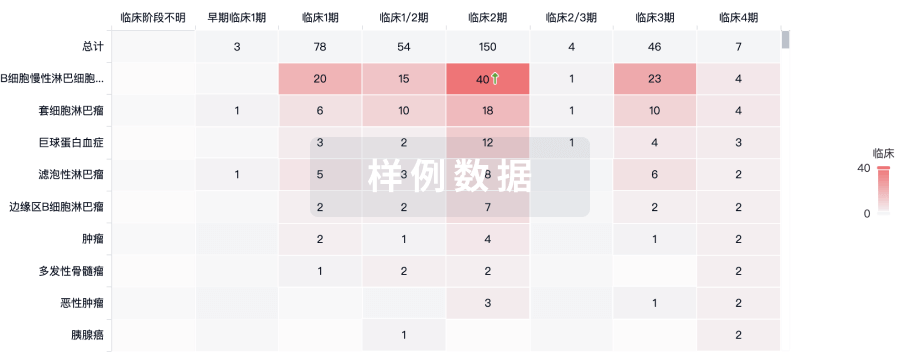
临床分析
紧跟全球注册中心的最新临床试验。
登录
或
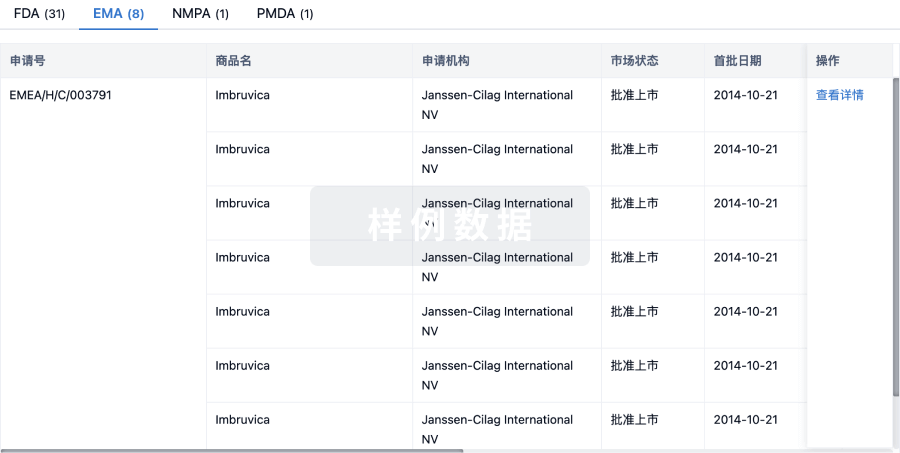
批准
利用最新的监管批准信息加速您的研究。
登录
或
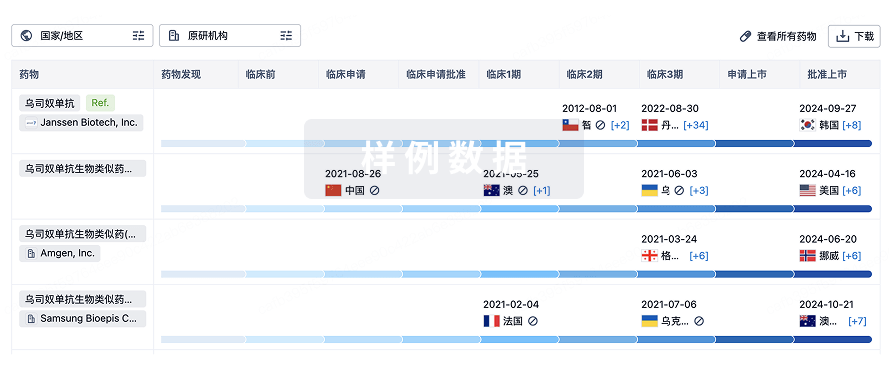
生物类似药
生物类似药在不同国家/地区的竞争态势。请注意临床1/2期并入临床2期,临床2/3期并入临床3期
登录
或
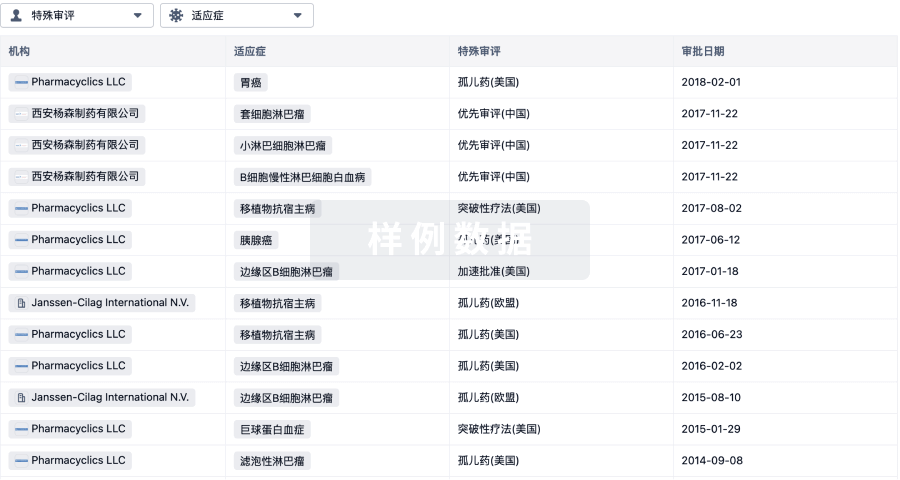
特殊审评
只需点击几下即可了解关键药物信息。
登录
或
生物医药百科问答
全新生物医药AI Agent 覆盖科研全链路,让突破性发现快人一步
立即开始免费试用!
智慧芽新药情报库是智慧芽专为生命科学人士构建的基于AI的创新药情报平台,助您全方位提升您的研发与决策效率。
立即开始数据试用!
智慧芽新药库数据也通过智慧芽数据服务平台,以API或者数据包形式对外开放,助您更加充分利用智慧芽新药情报信息。
生物序列数据库
生物药研发创新
免费使用
化学结构数据库
小分子化药研发创新
免费使用