Stool Testing Market to Grow by USD 391.87 Mn, Gastrointestinal Tract (GI) to be Largest Revenue generating Test Segment - Technavio
2022-10-10
NEW YORK, Oct. 10, 2022 /PRNewswire/ -- The stool testing market has been segmented by test (GI and Fecal occult) and geography (North America, Asia, Europe, and ROW). By test, the
GI segment will be the largest contributor to market growth during the forecast period. This growth is attributed to factors such as the increasing prevalence of chronic diseases coupled with the growing geriatric population.
Continue Reading
Preview
来源: PRNewswire
Technavio has announced its latest market research report titled Global Stool Testing Market 2022-2026
The
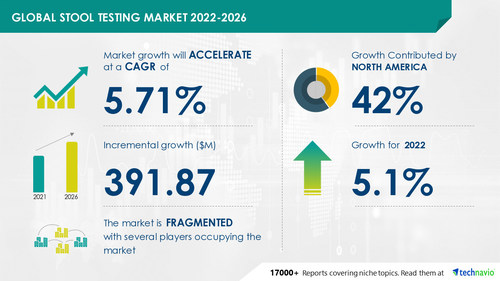
Stool Testing Market size is expected to increase by USD 391.87 million from 2021 to 2026. In addition, the growth momentum of the market will accelerate at a CAGR of 5.71% during the forecast period, according to the latest report from Technavio. This report presents a detailed picture of the market by way of study, synthesis, and summation of data from multiple sources through an analysis of key parameters.
Get a comprehensive report summary that describes the market size and forecast along with research methodology. The Sample Report is available in PDF format
Global Stool Testing Market 2022-2026: Segmentation
Product
GI
Fecal Occult
The stool testing market share growth in the GI segment will be significant during the forecast period. The global GI stool testing market is driven by the increasing prevalence of chronic diseases coupled with the growing geriatric population.
Geography
North America
Asia
Europe
Rest Of World (ROW)
42% of the market's growth will originate from North America during the forecast period. The increasing prevalence of chronic diseases such as stomach cancer, colon cancer, and pancreatic cancer will facilitate the stool testing market growth in North America over the forecast period.
The stool testing market covers the following areas
:
Stool Testing Market size
Stool Testing Market trends
Stool Testing Market industry analysis
Key Companies and their Offerings
Some of the major vendors of the stool testing market in l4 industry include AdvaCare Pharma, bioMerieux SA, Cardinal Health Inc, Cenogenics Corp., Clinical Genomics Technologies Pty Ltd., CTK Biotech Inc., Danaher Corp., DiaSorin SpA, Eiken Chemical Co. Ltd., Epitope Diagnostics Inc., Exact Sciences Corp., Genova Diagnostics Inc., Helena Laboratories Corp., Hologic Inc., McKesson Corp., Meridian Bioscience Inc., Pinnacle BioLabs, Polymedco CDP LLC, Quidel Corp., and ScheBo Biotech AG.
bioMerieux SA - The company offers a stool preprocessing device which is designed to implement sample preparation for nucleic acid extraction of viruses, bacteria, and parasites.
Cardinal Health Inc - The company offers a precision stool collector which is designed to collect and transport stool specimens.
Cenogenics Corp. - The company offers tri-slide patient envelope kits which is designed to check stool samples for hidden blood.
To get more insights on vendor offerings. Request a Sample Report!
Stool Testing Market 2022-2026: Key Highlights
CAGR of the market during the forecast period 2022-2026
Detailed information on factors that will assist stool testing market growth during the next five years
Estimation of the stool testing market size and its contribution to the parent market
Predictions on upcoming trends and changes in consumer behavior
The growth of the stool-testing market
Analysis of the market's competitive landscape and detailed information on vendors
Comprehensive details of factors that will challenge the growth of stool testing market vendors
Related Reports:
Biosensors in Life Sciences Market by Application and Geography – Forecast and Analysis 2021-2025
Life Sciences Analytics Market by End-user, Deployment, and Geography – Forecast and Analysis 2021-2025
Table of Contents:
1 Executive Summary
1.1 Market overview
Exhibit 01: Executive Summary – Chart on Market Overview
Exhibit 02: Executive Summary – Data Table on Market Overview
Exhibit 03: Executive Summary – Chart on Global Market Characteristics
Exhibit 04: Executive Summary – Chart on Market by Geography
Exhibit 05: Executive Summary – Chart on Market Segmentation by Test
Exhibit 06: Executive Summary – Chart on Incremental Growth
Exhibit 07: Executive Summary – Data Table on Incremental Growth
Exhibit 08: Executive Summary – Chart on Vendor Market Positioning
2 Market Landscape
2.1 Market ecosystem
Exhibit 09: Parent market
Exhibit 10: Market Characteristics
3 Market Sizing
3.1 Market definition
Exhibit 11: Offerings of vendors included in the market definition
3.2 Market segment analysis
Exhibit 12: Market segments
3.3 Market size 2021
3.4 Market outlook: Forecast for 2021-2026
Exhibit 13: Chart on Global - Market size and forecast 2021-2026 ($ million)
Exhibit 14: Data Table on Global - Market size and forecast 2021-2026 ($ million)
Exhibit 15: Chart on Global Market: Year-over-year growth 2021-2026 (%)
Exhibit 16: Data Table on Global Market: Year-over-year growth 2021-2026 (%)
4 Five Forces Analysis
4.1 Five forces summary
Exhibit 17: Five forces analysis - Comparison between 2021 and 2026
4.2 Bargaining power of buyers
Exhibit 18: Chart on Bargaining power of buyers – Impact of key factors 2021 and 2026
4.3 Bargaining power of suppliers
Exhibit 19: Bargaining power of suppliers – Impact of key factors in 2021 and 2026
4.4 Threat of new entrants
Exhibit 20: Threat of new entrants – Impact of key factors in 2021 and 2026
4.5 Threat of substitutes
Exhibit 21: Threat of substitutes – Impact of key factors in 2021 and 2026
4.6 Threat of rivalry
Exhibit 22: Threat of rivalry – Impact of key factors in 2021 and 2026
4.7 Market condition
Exhibit 23: Chart on Market condition - Five forces 2021 and 2026
5 Market Segmentation by Test
5.1 Market segments
Exhibit 24: Chart on Test - Market share 2021-2026 (%)
Exhibit 25: Data Table on Test - Market share 2021-2026 (%)
5.2 Comparison by Test
Exhibit 26: Chart on Comparison by Test
Exhibit 27: Data Table on Comparison by Test
5.3 GI - Market size and forecast 2021-2026
Exhibit 28: Chart on GI - Market size and forecast 2021-2026 ($ million)
Exhibit 29: Data Table on GI - Market size and forecast 2021-2026 ($ million)
Exhibit 30: Chart on GI - Year-over-year growth 2021-2026 (%)
Exhibit 31: Data Table on GI - Year-over-year growth 2021-2026 (%)
5.4 Fecal occult - Market size and forecast 2021-2026
Exhibit 32: Chart on Fecal occult - Market size and forecast 2021-2026 ($ million)
Exhibit 33: Data Table on Fecal occult - Market size and forecast 2021-2026 ($ million)
Exhibit 34: Chart on Fecal occult - Year-over-year growth 2021-2026 (%)
Exhibit 35: Data Table on Fecal occult - Year-over-year growth 2021-2026 (%)
5.5 Market opportunity by Test
Exhibit 36: Market opportunity by Test ($ million)
6 Customer Landscape
6.1 Customer landscape overview
Exhibit 37: Analysis of price sensitivity, lifecycle, customer purchase basket, adoption rates, and purchase criteria
7 Geographic Landscape
7.1 Geographic segmentation
Exhibit 38: Chart on Market share by geography 2021-2026 (%)
Exhibit 39: Data Table on Market share by geography 2021-2026 (%)
7.2 Geographic comparison
Exhibit 40: Chart on Geographic comparison
Exhibit 41: Data Table on Geographic comparison
7.3 North America - Market size and forecast 2021-2026
Exhibit 42: Chart on North America - Market size and forecast 2021-2026 ($ million)
Exhibit 43: Data Table on North America - Market size and forecast 2021-2026 ($ million)
Exhibit 44: Chart on North America - Year-over-year growth 2021-2026 (%)
Exhibit 45: Data Table on North America - Year-over-year growth 2021-2026 (%)
7.4 Asia - Market size and forecast 2021-2026
Exhibit 46: Chart on Asia - Market size and forecast 2021-2026 ($ million)
Exhibit 47: Data Table on Asia - Market size and forecast 2021-2026 ($ million)
Exhibit 48: Chart on Asia - Year-over-year growth 2021-2026 (%)
Exhibit 49: Data Table on Asia - Year-over-year growth 2021-2026 (%)
7.5 Europe - Market size and forecast 2021-2026
Exhibit 50: Chart on Europe - Market size and forecast 2021-2026 ($ million)
Exhibit 51: Data Table on Europe - Market size and forecast 2021-2026 ($ million)
Exhibit 52: Chart on Europe - Year-over-year growth 2021-2026 (%)
Exhibit 53: Data Table on Europe - Year-over-year growth 2021-2026 (%)
7.6 Rest of World (ROW) - Market size and forecast 2021-2026
Exhibit 54: Chart on Rest of World (ROW) - Market size and forecast 2021-2026 ($ million)
Exhibit 55: Data Table on Rest of World (ROW) - Market size and forecast 2021-2026 ($ million)
Exhibit 56: Chart on Rest of World (ROW) - Year-over-year growth 2021-2026 (%)
Exhibit 57: Data Table on Rest of World (ROW) - Year-over-year growth 2021-2026 (%)
7.7 US - Market size and forecast 2021-2026
Exhibit 58: Chart on US - Market size and forecast 2021-2026 ($ million)
Exhibit 59: Data Table on US - Market size and forecast 2021-2026 ($ million)
Exhibit 60: Chart on US - Year-over-year growth 2021-2026 (%)
Exhibit 61: Data Table on US - Year-over-year growth 2021-2026 (%)
7.8 China - Market size and forecast 2021-2026
Exhibit 62: Chart on China - Market size and forecast 2021-2026 ($ million)
Exhibit 63: Data Table on China - Market size and forecast 2021-2026 ($ million)
Exhibit 64: Chart on China - Year-over-year growth 2021-2026 (%)
Exhibit 65: Data Table on China - Year-over-year growth 2021-2026 (%)
7.9 UK - Market size and forecast 2021-2026
Exhibit 66: Chart on UK - Market size and forecast 2021-2026 ($ million)
Exhibit 67: Data Table on UK - Market size and forecast 2021-2026 ($ million)
Exhibit 68: Chart on UK - Year-over-year growth 2021-2026 (%)
Exhibit 69: Data Table on UK - Year-over-year growth 2021-2026 (%)
7.10 Germany - Market size and forecast 2021-2026
Exhibit 70: Chart on Germany - Market size and forecast 2021-2026 ($ million)
Exhibit 71: Data Table on Germany - Market size and forecast 2021-2026 ($ million)
Exhibit 72: Chart on Germany - Year-over-year growth 2021-2026 (%)
Exhibit 73: Data Table on Germany - Year-over-year growth 2021-2026 (%)
7.11 Canada - Market size and forecast 2021-2026
Exhibit 74: Chart on Canada - Market size and forecast 2021-2026 ($ million)
Exhibit 75: Data Table on Canada - Market size and forecast 2021-2026 ($ million)
Exhibit 76: Chart on Canada - Year-over-year growth 2021-2026 (%)
Exhibit 77: Data Table on Canada - Year-over-year growth 2021-2026 (%)
7.12 Market opportunity by geography
Exhibit 78: Market opportunity by geography ($ million)
8 Drivers, Challenges, and Trends
8.1 Market drivers
8.2 Market challenges
8.3 Impact of drivers and challenges
Exhibit 79: Impact of drivers and challenges in 2021 and 2026
8.4 Market trends
9 Vendor Landscape
9.1 Overview
9.2 Vendor landscape
Exhibit 80: Overview on Criticality of inputs and Factors of differentiation
9.3 Landscape disruption
Exhibit 81: Overview on factors of disruption
9.4 Industry risks
Exhibit 82: Impact of key risks on business
10 Vendor Analysis
10.1 Vendors covered
Exhibit 83: Vendors covered
10.2 Market positioning of vendors
Exhibit 84: Matrix on vendor position and classification
10.3 bioMerieux SA
Exhibit 85: bioMerieux SA - Overview
Exhibit 86: bioMerieux SA - Product / Service
Exhibit 87: bioMerieux SA - Key offerings
10.4 Cardinal Health Inc
Exhibit 88: Cardinal Health Inc - Overview
Exhibit 89: Cardinal Health Inc - Business segments
Exhibit 90: Cardinal Health Inc - Key news
Exhibit 91: Cardinal Health Inc - Key offerings
Exhibit 92: Cardinal Health Inc - Segment focus
10.5 Cenogenics Corp.
Exhibit 93: Cenogenics Corp. - Overview
Exhibit 94: Cenogenics Corp. - Product / Service
Exhibit 95: Cenogenics Corp. - Key offerings
10.6 CTK Biotech Inc.
Exhibit 96: CTK Biotech Inc. - Overview
Exhibit 97: CTK Biotech Inc. - Product / Service
Exhibit 98: CTK Biotech Inc. - Key offerings
10.7 Danaher Corp.
Exhibit 99: Danaher Corp. - Overview
Exhibit 100: Danaher Corp. - Business segments
Exhibit 101: Danaher Corp. - Key news
Exhibit 102: Danaher Corp. - Key offerings
Exhibit 103: Danaher Corp. - Segment focus
10.8 DiaSorin SpA
Exhibit 104: DiaSorin SpA - Overview
Exhibit 105: DiaSorin SpA - Business segments
Exhibit 106: DiaSorin SpA - Key news
Exhibit 107: DiaSorin SpA - Key offerings
Exhibit 108: DiaSorin SpA - Segment focus
Exhibit 109: Epitope Diagnostics Inc. - Overview
Exhibit 110: Epitope Diagnostics Inc. - Product / Service
Exhibit 111: Epitope Diagnostics Inc. - Key offerings
10.10 Genova Diagnostics Inc.
Exhibit 112: Genova Diagnostics Inc. - Overview
Exhibit 113: Genova Diagnostics Inc. - Product / Service
Exhibit 114: Genova Diagnostics Inc. - Key offerings
10.11 Quidel Corp.
Exhibit 115: Quidel Corp. - Overview
Exhibit 116: Quidel Corp. - Product / Service
Exhibit 117: Quidel Corp. - Key offerings
10.12 ScheBo Biotech AG
Exhibit 118: ScheBo Biotech AG - Overview
Exhibit 119: ScheBo Biotech AG - Product / Service
Exhibit 120: ScheBo Biotech AG - Key offerings
11.1 Scope of the report
11.2 Inclusions and exclusions checklist
Exhibit 121: Inclusions checklist
Exhibit 122: Exclusions checklist
11.3 Currency conversion rates for US$
Exhibit 123: Currency conversion rates for US$
11.4 Research methodology
Exhibit 124: Research methodology
Exhibit 125: Validation techniques employed for market sizing
Exhibit 126: Information sources
11.5 List of abbreviations
Exhibit 127: List of abbreviations
About Us
Technavio is a leading global technology research and advisory company. Their research and analysis focus on emerging market trends and provides actionable insights to help businesses identify market opportunities and develop effective strategies to optimize their market positions. With over 500 specialized analysts, Technavio's report library consists of more than 17,000 reports and counting, covering 800 technologies, spanning across 50 countries. Their client base consists of enterprises of all sizes, including more than 100 Fortune 500 companies. This growing client base relies on Technavio's comprehensive coverage, extensive research, and actionable market insights to identify opportunities in existing and potential markets and assess their competitive positions within changing market scenarios.
Contact
Technavio Research
Jesse Maida
US: +1 844 364 1100
UK: +44 203 893 3200
Email: [email protected]
Website: www.technavio.com/
SOURCE Technavio
更多内容,请访问原始网站
文中所述内容并不反映新药情报库及其所属公司任何意见及观点,如有版权侵扰或错误之处,请及时联系我们,我们会在24小时内配合处理。

靶点
-药物
-来和芽仔聊天吧


立即开始免费试用!
智慧芽新药情报库是智慧芽专为生命科学人士构建的基于AI的创新药情报平台,助您全方位提升您的研发与决策效率。
立即开始数据试用!
智慧芽新药库数据也通过智慧芽数据服务平台,以API或者数据包形式对外开放,助您更加充分利用智慧芽新药情报信息。