Probiotic Supplements Market Size in Canada to Grow by USD 59.76 Mn, Bacteria to be Largest Revenue-generating Type Segment - Technavio
2022-10-28
NEW YORK, Oct. 28, 2022 /PRNewswire/ -- The
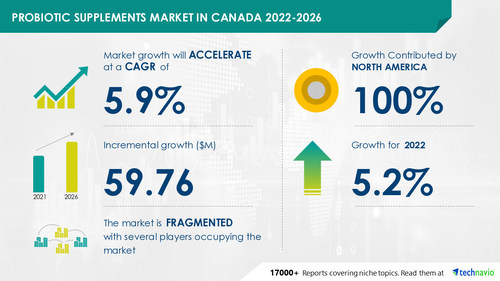
probiotic supplements market size in Canada is expected to grow by USD 59.76 million from 2021 to 2026. In addition, the growth momentum of the market will accelerate at a CAGR of 5.9% during the forecast period, according to Technavio. This growth can be attributed to increased awareness about lifestyle-related diseases. However, the stringent government regulations and guidelines can hamper the growth of the market during the next few years.
Continue Reading
Preview
来源: PRNewswire
Technavio has announced its latest market research report titled Probiotic Supplements Market in Canada 2022-2026
View a comprehensive report summary that describes the market size and forecast along with the research methodology. The FREE sample report is available in PDF format
Probiotic Supplements Market in Canada 2022-2026: Scope
The probiotic supplements market in Canada report covers the following areas:
Probiotic Supplements Market size in Canada
Probiotic Supplements Market trends in Canada
Probiotic Supplements Market industry analysis in Canada
Subscribe to our "Lite Plan" billed annually at USD 5000 that enables you to download 5 reports and view 100 reports per month
Probiotic Supplements Market in Canada 2022-2026: Segmentation
Probiotic Supplements Market in Canada is segmented as below:
Type
Bacteria
Yeast
The demand for probiotic bacteria supplements in Canada has increased due to the increased consumption of dietary supplements, including probiotic bacteria. In addition, factors such as banning the use of antibiotics in animal feed have led to an increase in the consumption of probiotic bacteria supplements in Canada. Furthermore, the increasing prevalence of chronic diseases such as diarrhea and intestinal diseases is expected to drive the growth of the probiotic supplements market in Canada during the forecast period.
Disease Type
Others
The benefits of taking probiotic supplements for GI diseases are many including - It fights inflammation and slows down the growth of harmful bacteria. It boosts the immune system and controls bowel movement speed. Therefore, the increased usage of probiotic supplements for the treatment of various GI diseases is expected to drive the growth of the probiotic supplements market in Canada during the forecast period.
Learn about the contribution of each segment summarized in concise infographics and thorough descriptions. View a FREE PDF Sample Report
Probiotic Supplements Market in Canada 2022-2026: Vendor Analysis
We provide a detailed analysis of around 25 vendors operating in the Probiotic Supplements Market in Canada, including American Biologics LLC, Biena Inc., BioGaia AB, Biotix Care, Church and Dwight Co. Inc., CUSTOM PROBIOTICS Inc., Deerland Probiotics and Enzymes Inc., International Flavors and Fragrances Inc., Kerry Group Plc, Kirkman Group, Koninklijke DSM NV, Lallemand Inc., Natural Factors Nutritional Products Ltd., NOVA Essentials Inc., Probi AB, Reckitt Benckiser Group PLC, RENEW LIFE, and The Procter and Gamble Co. The key offerings of some of these vendors are listed below:
American Biologics LLC - The company offers probiotic supplements such as Bio Bifidus plus for healthy digestive, immune, and mood functions.
BioGaia AB - The company offers probiotic supplements such as Protectis which is a food supplement.
Church and Dwight Co. Inc. - The company offers a probiotic supplement named Pro-B Probiotic, under the brand name RepHresh.
Kerry Group Plc - The company offers high-quality, premium probiotic products under the brand name Bio K Plus.
Kirkman Group - The company offers probiotic supplements such as Bifido Complex, Lacto and Bifido 8 Strain Probiotic Capsule and Saccharomyces Boulardii.
This report provides a full list of key vendors, their strategies, and the latest developments. Buy Now to gain access to exclusive vendor information
Probiotic Supplements Market in Canada 2022-2026: Key Highlights
CAGR of the market during the forecast period 2022-2026
Detailed information on factors that will assist the probiotic supplements market in Canada growth during the next five years
Estimation of the probiotic supplements market in Canada size and its contribution to the parent market
Predictions on upcoming trends and changes in consumer behavior
The growth of the probiotic supplements market in Canada
Analysis of the market's competitive landscape and detailed information on vendors
Comprehensive details of factors that will challenge the growth of the probiotic supplements market in Canadian vendors
Related Reports:
Probiotic Dietary Supplements Market by Application and Geography: Forecast and Analysis 2022-2026: The probiotic dietary supplements market share is expected to increase by USD 1.50 billion from 2021 to 2026.
Probiotic Products Market by End-user, Product, and Geography – Forecast and Analysis 2021-2025: The probiotic products market share is expected to increase by USD 26.85 million from 2021 to 2025
Table Of Contents :
1 Executive Summary
1.1 Market Overview
Exhibit 01: Executive Summary – Chart on Market Overview
Exhibit 02: Executive Summary – Data Table on Market Overview
Exhibit 03: Executive Summary – Chart on Country Market Characteristics
Exhibit 04: Executive Summary – Chart on Market Segmentation by Type
Exhibit 05: Executive Summary – Chart on Market Segmentation by Disease Type
Exhibit 06: Executive Summary – Chart on Vendor Market Positioning
2 Market Landscape
2.1 Market ecosystem
Exhibit 07: Parent market
Exhibit 08: Market Characteristics
3 Market Sizing
3.1 Market Definition
Exhibit 09: Offerings of vendors included in the market definition
3.2 Market segment analysis
Exhibit 10: Market segments
3.3 Market size 2021
3.4 Market outlook: Forecast for 2021-2026
Exhibit 11: Chart on Canada - Market size and forecast 2021-2026 ($ million)
Exhibit 12: Data Table on Canada - Market size and forecast 2021-2026 ($ million)
Exhibit 13: Chart on Canada: Year-over-year growth 2021-2026 (%)
Exhibit 14: Data Table on Canada: Year-over-year growth 2021-2026 (%)
4 Five Forces Analysis
4.1 Five forces summary
Exhibit 15: Five forces analysis - Comparison between 2021 and 2026
4.2 Bargaining power of buyers
Exhibit 16: Chart on Bargaining power of buyers – Impact of key factors 2021 and 2026
4.3 Bargaining power of suppliers
Exhibit 17: Bargaining power of suppliers – Impact of key factors in 2021 and 2026
4.4 Threat of new entrants
Exhibit 18: Threat of new entrants – Impact of key factors in 2021 and 2026
4.5 Threat of substitutes
Exhibit 19: Threat of substitutes – Impact of key factors in 2021 and 2026
4.6 Threat of rivalry
Exhibit 20: Threat of rivalry – Impact of key factors in 2021 and 2026
4.7 Market condition
Exhibit 21: Chart on Market condition - Five forces 2021 and 2026
5 Market Segmentation by Type
5.1 Market segments
Exhibit 22: Chart on Type - Market share 2021-2026 (%)
Exhibit 23: Data Table on Type - Market share 2021-2026 (%)
5.2 Comparison by Type
Exhibit 24: Chart on Comparison by Type
Exhibit 25: Data Table on Comparison by Type
5.3 Bacteria - Market size and forecast 2021-2026
Exhibit 26: Chart on Bacteria - Market size and forecast 2021-2026 ($ million)
Exhibit 27: Data Table on Bacteria - Market size and forecast 2021-2026 ($ million)
Exhibit 28: Chart on Bacteria - Year-over-year growth 2021-2026 (%)
Exhibit 29: Data Table on Bacteria - Year-over-year growth 2021-2026 (%)
5.4 Yeast - Market size and forecast 2021-2026
Exhibit 30: Chart on Yeast - Market size and forecast 2021-2026 ($ million)
Exhibit 31: Data Table on Yeast - Market size and forecast 2021-2026 ($ million)
Exhibit 32: Chart on Yeast - Year-over-year growth 2021-2026 (%)
Exhibit 33: Data Table on Yeast - Year-over-year growth 2021-2026 (%)
5.5 Market opportunity by Type
Exhibit 34: Market opportunity by Type ($ million)
6 Market Segmentation by Disease Type
6.1 Market segments
Exhibit 35: Chart on Disease Type - Market share 2021-2026 (%)
Exhibit 36: Data Table on Disease Type - Market share 2021-2026 (%)
6.2 Comparison by Disease Type
Exhibit 37: Chart on Comparison by Disease Type
Exhibit 38: Data Table on Comparison by Disease Type
6.3 Gastrointestinal diseases - Market size and forecast 2021-2026
Exhibit 39: Chart on Gastrointestinal diseases - Market size and forecast 2021-2026 ($ million)
Exhibit 40: Data Table on Gastrointestinal diseases - Market size and forecast 2021-2026 ($ million)
Exhibit 41: Chart on Gastrointestinal diseases - Year-over-year growth 2021-2026 (%)
Exhibit 42: Data Table on Gastrointestinal diseases - Year-over-year growth 2021-2026 (%)
6.4 Infectious diseases - Market size and forecast 2021-2026
Exhibit 43: Chart on Infectious diseases - Market size and forecast 2021-2026 ($ million)
Exhibit 44: Data Table on Infectious diseases - Market size and forecast 2021-2026 ($ million)
Exhibit 45: Chart on Infectious diseases - Year-over-year growth 2021-2026 (%)
Exhibit 46: Data Table on Infectious diseases - Year-over-year growth 2021-2026 (%)
6.5 Others - Market size and forecast 2021-2026
Exhibit 47: Chart on Others - Market size and forecast 2021-2026 ($ million)
Exhibit 48: Data Table on Others - Market size and forecast 2021-2026 ($ million)
Exhibit 49: Chart on Others - Year-over-year growth 2021-2026 (%)
Exhibit 50: Data Table on Others - Year-over-year growth 2021-2026 (%)
6.6 Market opportunity by Disease Type
Exhibit 51: Market opportunity by Disease Type ($ million)
7 Customer Landscape
7.1 Customer landscape overview
Exhibit 52: Analysis of price sensitivity, lifecycle, customer purchase basket, adoption rates, and purchase criteria
8 Drivers, Challenges, and Trends
8.1 Market drivers
8.2 Market challenges
8.3 Impact of drivers and challenges
Exhibit 53: Impact of drivers and challenges in 2021 and 2026
8.4 Market trends
9 Vendor Landscape
9.1 Overview
9.2 Vendor landscape
Exhibit 54: Overview on Criticality of inputs and Factors of differentiation
9.3 Landscape disruption
Exhibit 55: Overview on factors of disruption
9.4 Industry risks
Exhibit 56: Impact of key risks on business
10 Vendor Analysis
10.1 Vendors covered
Exhibit 57: Vendors covered
10.2 Market positioning of vendors
Exhibit 58: Matrix on vendor position and classification
10.3 American Biologics LLC
Exhibit 59: American Biologics LLC - Overview
Exhibit 60: American Biologics LLC - Product / Service
Exhibit 61: American Biologics LLC - Key offerings
10.4 BioGaia AB
Exhibit 62: BioGaia AB - Overview
Exhibit 63: BioGaia AB - Business segments
Exhibit 64: BioGaia AB - Key news
Exhibit 65: BioGaia AB - Key offerings
Exhibit 66: BioGaia AB - Segment focus
10.5 Church and Dwight Co. Inc.
Exhibit 67: Church and Dwight Co. Inc. - Overview
Exhibit 68: Church and Dwight Co. Inc. - Business segments
Exhibit 69: Church and Dwight Co. Inc. - Key news
Exhibit 70: Church and Dwight Co. Inc. - Key offerings
Exhibit 71: Church and Dwight Co. Inc. - Segment focus
10.6 Kerry Group Plc
Exhibit 72: Kerry Group Plc - Overview
Exhibit 73: Kerry Group Plc - Business segments
Exhibit 74: Kerry Group Plc - Key news
Exhibit 75: Kerry Group Plc - Key offerings
Exhibit 76: Kerry Group Plc - Segment focus
10.7 Kirkman Group
Exhibit 77: Kirkman Group - Overview
Exhibit 78: Kirkman Group - Product / Service
Exhibit 79: Kirkman Group - Key offerings
10.8 Koninklijke DSM NV
Exhibit 80: Koninklijke DSM NV - Overview
Exhibit 81: Koninklijke DSM NV - Business segments
Exhibit 82: Koninklijke DSM NV - Key news
Exhibit 83: Koninklijke DSM NV - Key offerings
Exhibit 84: Koninklijke DSM NV - Segment focus
10.9 Lallemand Inc.
Exhibit 85: Lallemand Inc. - Overview
Exhibit 86: Lallemand Inc. - Product / Service
Exhibit 87: Lallemand Inc. - Key offerings
10.10 Natural Factors Nutritional Products Ltd.
Exhibit 88: Natural Factors Nutritional Products Ltd. - Overview
Exhibit 89: Natural Factors Nutritional Products Ltd. - Product / Service
Exhibit 90: Natural Factors Nutritional Products Ltd. - Key offerings
10.11 NOVA Essentials Inc.
Exhibit 91: NOVA Essentials Inc. - Overview
Exhibit 92: NOVA Essentials Inc. - Product / Service
Exhibit 93: NOVA Essentials Inc. - Key offerings
10.12 Probi AB
Exhibit 94: Probi AB - Overview
Exhibit 95: Probi AB - Business segments
Exhibit 96: Probi AB - Key offerings
Exhibit 97: Probi AB - Segment focus
11 Appendix
11.1 Scope of the report
11.2 Inclusions and exclusions checklist
Exhibit 98: Inclusions checklist
Exhibit 99: Exclusions checklist
11.3 Currency conversion rates for US$
Exhibit 100: Currency conversion rates for US$
11.4 Research methodology
Exhibit 101: Research methodology
Exhibit 102: Validation techniques employed for market sizing
Exhibit 103: Information sources
11.5 List of abbreviations
Exhibit 104: List of abbreviations
About Us
Technavio is a leading global technology research and advisory company. Their research and analysis focus on emerging market trends and provide actionable insights to help businesses identify market opportunities and develop effective strategies to optimize their market positions. With over 500 specialized analysts, Technavio's report library consists of more than 17,000 reports and counting, covering 800 technologies, spanning 50 countries. Their client base consists of enterprises of all sizes, including more than 100 Fortune 500 companies. This growing client base relies on Technavio's comprehensive coverage, extensive research, and actionable market insights to identify opportunities in existing and potential markets and assess their competitive positions within changing market scenarios.
Contact
Technavio Research
Jesse Maida
Media & Marketing Executive
US: +1 844 364 1100
UK: +44 203 893 3200
Email: [email protected]
Website: www.technavio.com/
SOURCE Technavio
更多内容,请访问原始网站
文中所述内容并不反映新药情报库及其所属公司任何意见及观点,如有版权侵扰或错误之处,请及时联系我们,我们会在24小时内配合处理。

靶点
-药物
-来和芽仔聊天吧


立即开始免费试用!
智慧芽新药情报库是智慧芽专为生命科学人士构建的基于AI的创新药情报平台,助您全方位提升您的研发与决策效率。
立即开始数据试用!
智慧芽新药库数据也通过智慧芽数据服务平台,以API或者数据包形式对外开放,助您更加充分利用智慧芽新药情报信息。