Laboratory Bottle-top Dispenser Market: A Deep Dive Into Factors that will Help Vendors Stay Ahead of Competitors - Technavio
2022-09-15
Vendors are deploying organic and inorganic growth strategies to compete in the market
NEW YORK, Sept. 15, 2022 /PRNewswire/ -- One of the key vendors operating in the laboratory bottle-top dispenser market is Avantor Inc. The company offers laboratory bottle top dispenser through its subsidiary VWR International LLC. The market also has the presence of a few other major players, such as BRAND GmbH and Co. KG, DLAB Scientific Inc., Eppendorf AG, Grifols SA, Hamilton Bonaduz AG.
Challenges Faced by Laboratory Bottle-top Dispenser Market Vendors
Continue Reading
Preview
来源: PRNewswire
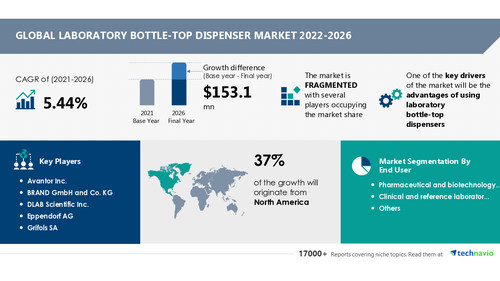
Technavio has announced its latest market research report titled Global Laboratory Bottle-top Dispenser Market 2022-2026
The laboratory bottle-top dispenser market is fragmented. The market is highly competitive and has prominent vendors with a sizeable market presence. The competition in the market will become more intense due to the development of electronic laboratory bottle-top dispensers during the forecast period.
Key Vendor Strategies to Overcome Market Challenges
Key strategies used by vendors to overcome the above challenges have been identified by Technavio. Vendors should innovate their offerings and build capabilities continuously, as there is less service differentiation. This will help them compete with larger players more effectively.
Technavio's reports provide key strategic initiatives used by vendors, along with key news and the latest developments. View our FREE PDF Sample Report Now
Market Growth Potential
The laboratory bottle-top dispenser market size is expected to grow by USD 153.1 million from 2021 to 2026. In addition, the growth momentum of the market will accelerate at a CAGR of 5.44% during the forecast period.
Technavio provides a comprehensive report summary describing the market size and forecast along with research methodology. The sample report is available in PDF format
Factors that will Drive the Market
Vendors in the laboratory bottle-top dispenser market can take advantage of a few factors that will work in their favor. The growing adoption of disposable laboratory bottle-top dispensers is one of these factors. Many diagnostic laboratories are being established to cater to the large disease burden globally. Laboratories and diagnostic centers conduct many tests and offer assessments for treatments to profile the diseases. Diagnostic laboratories have numerous samples from different patients. As a result, there is a high chance of cross-contamination. The use of disposable laboratory bottle-top dispensers reduces the chance of contamination of patient samples and helps in lowering hospital-acquired infections (HAI). Thus, the growing adoption of disposable laboratory bottle-top dispensers will fuel the growth of the market during the forecast period.
Technavio has identified key trends, drivers, and challenges in the market, which will help vendors improve their strategies to stay ahead of their competitors. View our FREE PDF Sample Report
Related Reports
Laboratory Disposables Market Growth, Size, Trends, Analysis Report by Type, Application, Region and Segment Forecast 2022-2026: Factors such as lack of differentiation among vendors may impede market growth.
Blood Warmer Devices Market by Product and Geography - Forecast and Analysis 2022-2026: Factors such as product recalls and stringent regulatory approvals may impede the market growth.
Browse Health Care Market Reports
Table of Contents
1 Executive Summary
1.1 Market overview
Exhibit 01: Executive Summary – Chart on Market Overview
Exhibit 02: Executive Summary – Data Table on Market Overview
Exhibit 03: Executive Summary – Chart on Global Market Characteristics
Exhibit 04: Executive Summary – Chart on Market by Geography
Exhibit 05: Executive Summary – Chart on Market Segmentation by End-user
Exhibit 06: Executive Summary – Chart on Incremental Growth
Exhibit 07: Executive Summary – Data Table on Incremental Growth
Exhibit 08: Executive Summary – Chart on Vendor Market Positioning
2 Market Landscape
2.1 Market ecosystem
Exhibit 09: Parent market
Exhibit 10: Market Characteristics
3 Market Sizing
3.1 Market definition
Exhibit 11: Offerings of vendors included in the market definition
3.2 Market segment analysis
Exhibit 12: Market segments
3.3 Market size 2021
3.4 Market outlook: Forecast for 2021-2026
Exhibit 13: Chart on Global - Market size and forecast 2021-2026 ($ million)
Exhibit 14: Data Table on Global - Market size and forecast 2021-2026 ($ million)
Exhibit 15: Chart on Global Market: Year-over-year growth 2021-2026 (%)
Exhibit 16: Data Table on Global Market: Year-over-year growth 2021-2026 (%)
4 Five Forces Analysis
4.1 Five forces summary
Exhibit 17: Five forces analysis - Comparison between 2021 and 2026
4.2 Bargaining power of buyers
Exhibit 18: Chart on Bargaining power of buyers – Impact of key factors 2021 and 2026
4.3 Bargaining power of suppliers
Exhibit 19: Bargaining power of suppliers – Impact of key factors in 2021 and 2026
4.4 Threat of new entrants
Exhibit 20: Threat of new entrants – Impact of key factors in 2021 and 2026
4.5 Threat of substitutes
Exhibit 21: Threat of substitutes – Impact of key factors in 2021 and 2026
4.6 Threat of rivalry
Exhibit 22: Threat of rivalry – Impact of key factors in 2021 and 2026
4.7 Market condition
Exhibit 23: Chart on Market condition - Five forces 2021 and 2026
5 Market Segmentation by End-user
5.1 Market segments
Exhibit 24: Chart on End-user - Market share 2021-2026 (%)
Exhibit 25: Data Table on End-user - Market share 2021-2026 (%)
5.2 Comparison by End-user
Exhibit 26: Chart on Comparison by End-user
Exhibit 27: Data Table on Comparison by End-user
5.3 Pharmaceutical and biotechnology companies - Market size and forecast 2021-2026
Exhibit 28: Chart on Pharmaceutical and biotechnology companies - Market size and forecast 2021-2026 ($ million)
Exhibit 29: Data Table on Pharmaceutical and biotechnology companies - Market size and forecast 2021-2026 ($ million)
Exhibit 30: Chart on Pharmaceutical and biotechnology companies - Year-over-year growth 2021-2026 (%)
Exhibit 31: Data Table on Pharmaceutical and biotechnology companies - Year-over-year growth 2021-2026 (%)
5.4 Clinical and reference laboratories - Market size and forecast 2021-2026
Exhibit 32: Chart on Clinical and reference laboratories - Market size and forecast 2021-2026 ($ million)
Exhibit 33: Data Table on Clinical and reference laboratories - Market size and forecast 2021-2026 ($ million)
Exhibit 34: Chart on Clinical and reference laboratories - Year-over-year growth 2021-2026 (%)
Exhibit 35: Data Table on Clinical and reference laboratories - Year-over-year growth 2021-2026 (%)
5.5 Others - Market size and forecast 2021-2026
Exhibit 36: Chart on Others - Market size and forecast 2021-2026 ($ million)
Exhibit 37: Data Table on Others - Market size and forecast 2021-2026 ($ million)
Exhibit 38: Chart on Others - Year-over-year growth 2021-2026 (%)
Exhibit 39: Data Table on Others - Year-over-year growth 2021-2026 (%)
5.6 Market opportunity by End-user
Exhibit 40: Market opportunity by End-user ($ million)
6 Customer Landscape
6.1 Customer landscape overview
Exhibit 41: Analysis of price sensitivity, lifecycle, customer purchase basket, adoption rates, and purchase criteria
7 Geographic Landscape
7.1 Geographic segmentation
Exhibit 42: Chart on Market share by geography 2021-2026 (%)
Exhibit 43: Data Table on Market share by geography 2021-2026 (%)
7.2 Geographic comparison
Exhibit 44: Chart on Geographic comparison
Exhibit 45: Data Table on Geographic comparison
7.3 North America - Market size and forecast 2021-2026
Exhibit 46: Chart on North America - Market size and forecast 2021-2026 ($ million)
Exhibit 47: Data Table on North America - Market size and forecast 2021-2026 ($ million)
Exhibit 48: Chart on North America - Year-over-year growth 2021-2026 (%)
Exhibit 49: Data Table on North America - Year-over-year growth 2021-2026 (%)
7.4 Europe - Market size and forecast 2021-2026
Exhibit 50: Chart on Europe - Market size and forecast 2021-2026 ($ million)
Exhibit 51: Data Table on Europe - Market size and forecast 2021-2026 ($ million)
Exhibit 52: Chart on Europe - Year-over-year growth 2021-2026 (%)
Exhibit 53: Data Table on Europe - Year-over-year growth 2021-2026 (%)
7.5 Asia - Market size and forecast 2021-2026
Exhibit 54: Chart on Asia - Market size and forecast 2021-2026 ($ million)
Exhibit 55: Data Table on Asia - Market size and forecast 2021-2026 ($ million)
Exhibit 56: Chart on Asia - Year-over-year growth 2021-2026 (%)
Exhibit 57: Data Table on Asia - Year-over-year growth 2021-2026 (%)
7.6 Rest of World (ROW) - Market size and forecast 2021-2026
Exhibit 58: Chart on Rest of World (ROW) - Market size and forecast 2021-2026 ($ million)
Exhibit 59: Data Table on Rest of World (ROW) - Market size and forecast 2021-2026 ($ million)
Exhibit 60: Chart on Rest of World (ROW) - Year-over-year growth 2021-2026 (%)
Exhibit 61: Data Table on Rest of World (ROW) - Year-over-year growth 2021-2026 (%)
7.7 US - Market size and forecast 2021-2026
Exhibit 62: Chart on US - Market size and forecast 2021-2026 ($ million)
Exhibit 63: Data Table on US - Market size and forecast 2021-2026 ($ million)
Exhibit 64: Chart on US - Year-over-year growth 2021-2026 (%)
Exhibit 65: Data Table on US - Year-over-year growth 2021-2026 (%)
7.8 UK - Market size and forecast 2021-2026
Exhibit 66: Chart on UK - Market size and forecast 2021-2026 ($ million)
Exhibit 67: Data Table on UK - Market size and forecast 2021-2026 ($ million)
Exhibit 68: Chart on UK - Year-over-year growth 2021-2026 (%)
Exhibit 69: Data Table on UK - Year-over-year growth 2021-2026 (%)
7.9 China - Market size and forecast 2021-2026
Exhibit 70: Chart on China - Market size and forecast 2021-2026 ($ million)
Exhibit 71: Data Table on China - Market size and forecast 2021-2026 ($ million)
Exhibit 72: Chart on China - Year-over-year growth 2021-2026 (%)
Exhibit 73: Data Table on China - Year-over-year growth 2021-2026 (%)
7.10 Canada - Market size and forecast 2021-2026
Exhibit 74: Chart on Canada - Market size and forecast 2021-2026 ($ million)
Exhibit 75: Data Table on Canada - Market size and forecast 2021-2026 ($ million)
Exhibit 76: Chart on Canada - Year-over-year growth 2021-2026 (%)
Exhibit 77: Data Table on Canada - Year-over-year growth 2021-2026 (%)
7.11 Japan - Market size and forecast 2021-2026
Exhibit 78: Chart on Japan - Market size and forecast 2021-2026 ($ million)
Exhibit 79: Data Table on Japan - Market size and forecast 2021-2026 ($ million)
Exhibit 80: Chart on Japan - Year-over-year growth 2021-2026 (%)
Exhibit 81: Data Table on Japan - Year-over-year growth 2021-2026 (%)
7.12 Market opportunity by geography
Exhibit 82: Market opportunity by geography ($ million)
8 Drivers, Challenges, and Trends
8.1 Market drivers
8.2 Market challenges
8.3 Impact of drivers and challenges
Exhibit 83: Impact of drivers and challenges in 2021 and 2026
8.4 Market trends
9 Vendor Landscape
9.1 Overview
9.2 Vendor landscape
Exhibit 84: Overview on Criticality of inputs and Factors of differentiation
9.3 Landscape disruption
Exhibit 85: Overview on factors of disruption
9.4 Industry risks
Exhibit 86: Impact of key risks on business
10 Vendor Analysis
10.1 Vendors covered
Exhibit 87: Vendors covered
10.2 Market positioning of vendors
Exhibit 88: Matrix on vendor position and classification
10.3 Avantor Inc.
Exhibit 89: Avantor Inc. - Overview
Exhibit 90: Avantor Inc. - Business segments
Exhibit 91: Avantor Inc. - Key news
Exhibit 92: Avantor Inc. - Key offerings
Exhibit 93: Avantor Inc. - Segment focus
10.4 BRAND GmbH and Co. KG
Exhibit 94: BRAND GmbH and Co. KG - Overview
Exhibit 95: BRAND GmbH and Co. KG - Product / Service
Exhibit 96: BRAND GmbH and Co. KG - Key news
Exhibit 97: BRAND GmbH and Co. KG - Key offerings
10.5 Eppendorf AG
Exhibit 98: Eppendorf AG - Overview
Exhibit 99: Eppendorf AG - Product / Service
Exhibit 100: Eppendorf AG - Key news
Exhibit 101: Eppendorf AG - Key offerings
10.6 Grifols SAGrifols SA
Exhibit 102: Grifols SAGrifols SA - Overview
Exhibit 103: Grifols SA - Business segments
Exhibit 104: Grifols SAGrifols SA - Key offerings
Exhibit 105: Grifols SAGrifols SA - Segment focus
10.7 Hamilton Bonaduz AG
Exhibit 106: Hamilton Bonaduz AG - Overview
Exhibit 107: Hamilton Bonaduz AG - Product / Service
Exhibit 108: Hamilton Bonaduz AG - Key offerings
10.8 Hirschmann Laborgerate GmbH and Co. KG
Exhibit 109: Hirschmann Laborgerate GmbH and Co. KG - Overview
Exhibit 110: Hirschmann Laborgerate GmbH and Co. KG - Product / Service
Exhibit 111: Hirschmann Laborgerate GmbH and Co. KG - Key offerings
10.9 Kartell SpA
Exhibit 112: Kartell SpA - Overview
Exhibit 113: Kartell SpA - Product / Service
Exhibit 114: Kartell SpA - Key offerings
10.10 Merck KGaA
Exhibit 115: Merck KGaA - Overview
Exhibit 116: Merck KGaA - Business segments
Exhibit 117: Merck KGaA - Key news
Exhibit 118: Merck KGaA - Key offerings
Exhibit 119: Merck KGaA - Segment focus
10.11 Sartorius AG
Exhibit 120: Sartorius AG - Overview
Exhibit 121: Sartorius AG - Business segments
Exhibit 122: Sartorius AG - Key news
Exhibit 123: Sartorius AG - Key offerings
Exhibit 124: Sartorius AG - Segment focus
Exhibit 125: Thermo Fisher Scientific Inc. - Overview
Exhibit 126: Thermo Fisher Scientific Inc. - Business segments
Exhibit 127: Thermo Fisher Scientific Inc. - Key news
Exhibit 128: Thermo Fisher Scientific Inc. - Key offerings
Exhibit 129: Thermo Fisher Scientific Inc. - Segment focus
11.1 Scope of the report
11.2 Inclusions and exclusions checklist
Exhibit 130: Inclusions checklist
Exhibit 131: Exclusions checklist
11.3 Currency conversion rates for US$
Exhibit 132: Currency conversion rates for US$
11.4 Research methodology
Exhibit 133: Research methodology
Exhibit 134: Validation techniques employed for market sizing
Exhibit 135: Information sources
11.5 List of abbreviations
Exhibit 136: List of abbreviations
About Us
Technavio is a leading global technology research and advisory company. Their research and analysis focus on emerging market trends and provides actionable insights to help businesses identify market opportunities and develop effective strategies to optimize their market positions. With over 500 specialized analysts, Technavio's report library consists of more than 17,000 reports and counting, covering 800 technologies, spanning across 50 countries. Their client base consists of enterprises of all sizes, including more than 100 Fortune 500 companies. This growing client base relies on Technavio's comprehensive coverage, extensive research, and actionable market insights to identify opportunities in existing and potential markets and assess their competitive positions within changing market scenarios.
Contact
Technavio Research
Jesse Maida
US: +1 844 364 1100
UK: +44 203 893 3200
Email: [email protected]
Website: www.technavio.com/
SOURCE Technavio
更多内容,请访问原始网站
文中所述内容并不反映新药情报库及其所属公司任何意见及观点,如有版权侵扰或错误之处,请及时联系我们,我们会在24小时内配合处理。

适应症
靶点
-来和芽仔聊天吧


立即开始免费试用!
智慧芽新药情报库是智慧芽专为生命科学人士构建的基于AI的创新药情报平台,助您全方位提升您的研发与决策效率。
立即开始数据试用!
智慧芽新药库数据也通过智慧芽数据服务平台,以API或者数据包形式对外开放,助您更加充分利用智慧芽新药情报信息。