Rural Clinical and Healthcare Logistics Market to grow by USD 1.95 Bn Vendors to Deploy Growth Strategies Such as developing efficient healthcare logistics- Technavio
2022-11-08
NEW YORK, Nov. 8, 2022 /PRNewswire/ -- The global rural clinical and healthcare logistics market is highly competitive and fragmented, with the presence of various established vendors. The vendors are continuously working on developing efficient and high-performance rural clinical and healthcare logistics for end-users operating in the manufacturing sector. International vendors face some competition from many regional vendors. Thus, established vendors are finding ways to differentiate their products in the global rural clinical and healthcare logistics market to gain a high market share and build a competitive advantage. The focus of market players will be on establishing better distribution networks and delivering improved services to attain a competitive edge in the market.
Continue Reading
Preview
来源: PRNewswire
Technavio has announced its latest market research report titled Global Rural Clinical and Healthcare Logistics Market 2022-2026
The
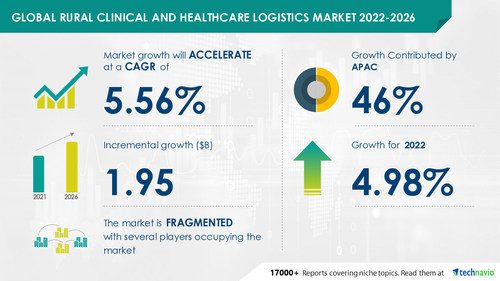
rural clinical and healthcare logistics market size is expected to grow by USD 1.95 billion from 2021 to 2026. In addition, the growth momentum of the market will accelerate at a CAGR of 5.56% during the forecast period, according to Technavio.
View a comprehensive report summary that describes the market size and forecast along with the research methodology.
Request a FREE PDF Sample Report
Rural Clinical and Healthcare Logistics Market 2022-2026: Scope
The rural clinical and healthcare logistics market report covers the following areas:
Rural Clinical and Healthcare Logistics Market size
Rural Clinical and Healthcare Logistics Market trends
Rural Clinical and Healthcare Logistics Market industry analysis
This study identifies the introduction of blockchain technology in the logistics industry as one of the prime reasons driving the rural clinical and healthcare logistics market growth during the next few years.
Subscribe to our "Basic Plan" billed annually at USD 5000
that enables you to download 5 reports and view 100 reports per month
Rural Clinical and Healthcare Logistics Market 2022-2026: Segmentation
Rural Clinical and Healthcare Logistics Market is segmented as below:
Service
Transportation
Warehousing
The rural clinical and healthcare logistics market share growth by the transportation segment will be significant during the forecast period. The transportation segment in the global rural clinical and healthcare logistics market is the largest segment and is growing rapidly. The segment deals with the movement of pharmaceutical products and medical devices using different modes of transport, such as air, water, and roadways. The market by this segment is expected to witness high growth owing to the growth in the global healthcare industry and increased government expenditure on rural logistics infrastructure.
Geography
North America
Europe
South America
Middle East And Africa
46% of the market's growth will originate from APAC during the forecast period. China and India are the key markets for rural clinical and healthcare logistics market in APAC.
The increase in global demand for pharmaceuticals and medical devices will facilitate the rural clinical and healthcare logistics market growth in APAC over the forecast period.
Learn about the contribution of each segment summarized in concise infographics and thorough descriptions.
Download a FREE Sample Report
Rural Clinical and Healthcare Logistics Market 2022-2026: Vendor Analysis
We provide a detailed analysis of around 25 vendors operating in the rural Clinical and healthcare logistics market, including Agility Public Warehousing Co K.S.C.P, AmerisourceBergen Corp., C.H. Robinson Worldwide Inc., Cavalier Logistics Inc., CMA CGM S.A., Cold Chain Technologies LLC, DB Schenker, Deutsche Post AG, Distribution Management Corp Inc., DSV Panalpina AS, FedEx Corp., Global Logistics Network SAS, Kuehne Nagel International AG, MARKEN Ltd., Matternet, Nippon Yusen Kabushiki Kaisha, S.F. Holding Co. Ltd, Siam Cement PCL, United Parcel Service Inc., and Zipline.
This report provides a full list of key vendors, their strategies, and the latest developments.
Buy Now
for detailed vendor information
Rural Clinical and Healthcare Logistics Market 2022-2026: Key Highlights
CAGR of the market during the forecast period 2022-2026
Detailed information on factors that will assist rural clinical and healthcare logistics market growth during the next five years
Estimation of the rural clinical and healthcare logistics market size and its contribution to the parent market
Predictions on upcoming trends and changes in consumer behavior
The growth of the rural clinical and healthcare logistics market
Analysis of the market's competitive landscape and detailed information on vendors
Comprehensive details of factors that will challenge the growth of rural clinical and healthcare logistics market vendors
Related Reports:
Chemical Logistics Market by Service and Geography – Forecast and Analysis 2021-2025: The chemical logistics market share is expected to increase by USD 24.73 billion from 2020 to 2025.
Apparel Logistics Market by Service and Geography – Forecast and Analysis 2022-2026: The apparel logistics market share is expected to increase by USD 32.54 million from 2021 to 2026.
Table Of Contents :
1 Executive Summary
1.1 Market Overview
Exhibit 01: Executive Summary – Chart on Market Overview
Exhibit 02: Executive Summary – Data Table on Market Overview
Exhibit 03: Executive Summary – Chart on Global Market Characteristics
Exhibit 04: Executive Summary – Chart on Market by Geography
Exhibit 05: Executive Summary – Chart on Market Segmentation by Service
Exhibit 06: Executive Summary – Chart on Incremental Growth
Exhibit 07: Executive Summary – Data Table on Incremental Growth
Exhibit 08: Executive Summary – Chart on Vendor Market Positioning
2 Market Landscape
2.1 Market ecosystem
Exhibit 09: Parent market
Exhibit 10: Market Characteristics
3 Market Sizing
3.1 Market Definition
Exhibit 11: Offerings of vendors included in the market definition
3.2 Market segment analysis
Exhibit 12: Market segments
3.3 Market size 2021
3.4 Market outlook: Forecast for 2021-2026
Exhibit 13: Chart on Global - Market size and forecast 2021-2026 ($ million)
Exhibit 14: Data Table on Global - Market size and forecast 2021-2026 ($ million)
Exhibit 15: Chart on Global Market: Year-over-year growth 2021-2026 (%)
Exhibit 16: Data Table on Global Market: Year-over-year growth 2021-2026 (%)
4 Five Forces Analysis
4.1 Five forces summary
Exhibit 17: Five forces analysis - Comparison between 2021 and 2026
4.2 Bargaining power of buyers
Exhibit 18: Chart on Bargaining power of buyers – Impact of key factors 2021 and 2026
4.3 Bargaining power of suppliers
Exhibit 19: Bargaining power of suppliers – Impact of key factors in 2021 and 2026
4.4 Threat of new entrants
Exhibit 20: Threat of new entrants – Impact of key factors in 2021 and 2026
4.5 Threat of substitutes
Exhibit 21: Threat of substitutes – Impact of key factors in 2021 and 2026
4.6 Threat of rivalry
Exhibit 22: Threat of rivalry – Impact of key factors in 2021 and 2026
4.7 Market condition
Exhibit 23: Chart on Market condition - Five forces 2021 and 2026
5 Market Segmentation by Service
5.1 Market segments
Exhibit 24: Chart on Service - Market share 2021-2026 (%)
Exhibit 25: Data Table on Service - Market share 2021-2026 (%)
5.2 Comparison by Service
Exhibit 26: Chart on Comparison by Service
Exhibit 27: Data Table on Comparison by Service
5.3 Transportation - Market size and forecast 2021-2026
Exhibit 28: Chart on Transportation - Market size and forecast 2021-2026 ($ million)
Exhibit 29: Data Table on Transportation - Market size and forecast 2021-2026 ($ million)
Exhibit 30: Chart on Transportation - Year-over-year growth 2021-2026 (%)
Exhibit 31: Data Table on Transportation - Year-over-year growth 2021-2026 (%)
5.4 Warehousing - Market size and forecast 2021-2026
Exhibit 32: Chart on Warehousing - Market size and forecast 2021-2026 ($ million)
Exhibit 33: Data Table on Warehousing - Market size and forecast 2021-2026 ($ million)
Exhibit 34: Chart on Warehousing - Year-over-year growth 2021-2026 (%)
Exhibit 35: Data Table on Warehousing - Year-over-year growth 2021-2026 (%)
5.5 Market opportunity by Service
Exhibit 36: Market opportunity by Service ($ million)
6 Customer Landscape
6.1 Customer landscape overview
Exhibit 37: Analysis of price sensitivity, lifecycle, customer purchase basket, adoption rates, and purchase criteria
7 Geographic Landscape
7.1 Geographic segmentation
Exhibit 38: Chart on Market share by geography 2021-2026 (%)
Exhibit 39: Data Table on Market share by geography 2021-2026 (%)
7.2 Geographic comparison
Exhibit 40: Chart on Geographic comparison
Exhibit 41: Data Table on Geographic comparison
7.3 APAC - Market size and forecast 2021-2026
Exhibit 42: Chart on APAC - Market size and forecast 2021-2026 ($ million)
Exhibit 43: Data Table on APAC - Market size and forecast 2021-2026 ($ million)
Exhibit 44: Chart on APAC - Year-over-year growth 2021-2026 (%)
Exhibit 45: Data Table on APAC - Year-over-year growth 2021-2026 (%)
7.4 North America - Market size and forecast 2021-2026
Exhibit 46: Chart on North America - Market size and forecast 2021-2026 ($ million)
Exhibit 47: Data Table on North America - Market size and forecast 2021-2026 ($ million)
Exhibit 48: Chart on North America - Year-over-year growth 2021-2026 (%)
Exhibit 49: Data Table on North America - Year-over-year growth 2021-2026 (%)
7.5 Europe - Market size and forecast 2021-2026
Exhibit 50: Chart on Europe - Market size and forecast 2021-2026 ($ million)
Exhibit 51: Data Table on Europe - Market size and forecast 2021-2026 ($ million)
Exhibit 52: Chart on Europe - Year-over-year growth 2021-2026 (%)
Exhibit 53: Data Table on Europe - Year-over-year growth 2021-2026 (%)
7.6 South America - Market size and forecast 2021-2026
Exhibit 54: Chart on South America - Market size and forecast 2021-2026 ($ million)
Exhibit 55: Data Table on South America - Market size and forecast 2021-2026 ($ million)
Exhibit 56: Chart on South America - Year-over-year growth 2021-2026 (%)
Exhibit 57: Data Table on South America - Year-over-year growth 2021-2026 (%)
7.7 Middle East and Africa - Market size and forecast 2021-2026
Exhibit 58: Chart on Middle East and Africa - Market size and forecast 2021-2026 ($ million)
Exhibit 59: Data Table on Middle East and Africa - Market size and forecast 2021-2026 ($ million)
Exhibit 60: Chart on Middle East and Africa - Year-over-year growth 2021-2026 (%)
Exhibit 61: Data Table on Middle East and Africa - Year-over-year growth 2021-2026 (%)
7.8 China - Market size and forecast 2021-2026
Exhibit 62: Chart on China - Market size and forecast 2021-2026 ($ million)
Exhibit 63: Data Table on China - Market size and forecast 2021-2026 ($ million)
Exhibit 64: Chart on China - Year-over-year growth 2021-2026 (%)
Exhibit 65: Data Table on China - Year-over-year growth 2021-2026 (%)
7.9 India - Market size and forecast 2021-2026
Exhibit 66: Chart on India - Market size and forecast 2021-2026 ($ million)
Exhibit 67: Data Table on India - Market size and forecast 2021-2026 ($ million)
Exhibit 68: Chart on India - Year-over-year growth 2021-2026 (%)
Exhibit 69: Data Table on India - Year-over-year growth 2021-2026 (%)
7.10 US - Market size and forecast 2021-2026
Exhibit 70: Chart on US - Market size and forecast 2021-2026 ($ million)
Exhibit 71: Data Table on US - Market size and forecast 2021-2026 ($ million)
Exhibit 72: Chart on US - Year-over-year growth 2021-2026 (%)
Exhibit 73: Data Table on US - Year-over-year growth 2021-2026 (%)
7.11 Brazil - Market size and forecast 2021-2026
Exhibit 74: Chart on Brazil - Market size and forecast 2021-2026 ($ million)
Exhibit 75: Data Table on Brazil - Market size and forecast 2021-2026 ($ million)
Exhibit 76: Chart on Brazil - Year-over-year growth 2021-2026 (%)
Exhibit 77: Data Table on Brazil - Year-over-year growth 2021-2026 (%)
7.12 Mexico - Market size and forecast 2021-2026
Exhibit 78: Chart on Mexico - Market size and forecast 2021-2026 ($ million)
Exhibit 79: Data Table on Mexico - Market size and forecast 2021-2026 ($ million)
Exhibit 80: Chart on Mexico - Year-over-year growth 2021-2026 (%)
Exhibit 81: Data Table on Mexico - Year-over-year growth 2021-2026 (%)
7.13 Market opportunity by geography
Exhibit 82: Market opportunity by geography ($ million)
8 Drivers, Challenges, and Trends
8.1 Market drivers
8.2 Market challenges
8.3 Impact of drivers and challenges
Exhibit 83: Impact of drivers and challenges in 2021 and 2026
8.4 Market trends
9 Vendor Landscape
9.1 Overview
9.2 Vendor landscape
Exhibit 84: Overview on Criticality of inputs and Factors of differentiation
9.3 Landscape disruption
Exhibit 85: Overview on factors of disruption
9.4 Industry risks
Exhibit 86: Impact of key risks on business
10 Vendor Analysis
10.1 Vendors covered
Exhibit 87: Vendors covered
10.2 Market positioning of vendors
Exhibit 88: Matrix on vendor position and classification
Exhibit 89: AmerisourceBergen Corp. - Overview
Exhibit 90: AmerisourceBergen Corp. - Business segments
Exhibit 91: AmerisourceBergen Corp. - Key offerings
Exhibit 92: AmerisourceBergen Corp. - Segment focus
10.4 C.H. Robinson Worldwide Inc.
Exhibit 93: C.H. Robinson Worldwide Inc. - Overview
Exhibit 94: C.H. Robinson Worldwide Inc. - Business segments
Exhibit 95: C.H. Robinson Worldwide Inc. - Key news
Exhibit 96: C.H. Robinson Worldwide Inc. - Key offerings
Exhibit 97: C.H. Robinson Worldwide Inc. - Segment focus
10.5 CMA CGM S.A.
Exhibit 98: CMA CGM S.A. - Overview
Exhibit 99: CMA CGM S.A. - Business segments
Exhibit 100: CMA CGM S.A. - Key news
Exhibit 101: CMA CGM S.A. - Key offerings
Exhibit 102: CMA CGM S.A. - Segment focus
10.6 Cold Chain Technologies LLC
Exhibit 103: Cold Chain Technologies LLC - Overview
Exhibit 104: Cold Chain Technologies LLC - Product / Service
Exhibit 105: Cold Chain Technologies LLC - Key offerings
10.7 DB Schenker
Exhibit 106: DB Schenker - Overview
Exhibit 107: DB Schenker - Business segments
Exhibit 108: DB Schenker - Key offerings
Exhibit 109: DB Schenker - Segment focus
10.8 Deutsche Post AG
Exhibit 110: Deutsche Post AG - Overview
Exhibit 111: Deutsche Post AG - Business segments
Exhibit 112: Deutsche Post AG - Key news
Exhibit 113: Deutsche Post AG - Key offerings
Exhibit 114: Deutsche Post AG - Segment focus
10.9 DSV Panalpina AS
Exhibit 115: DSV Panalpina AS - Overview
Exhibit 116: DSV Panalpina AS - Business segments
Exhibit 117: DSV Panalpina AS - Key offerings
Exhibit 118: DSV Panalpina AS - Segment focus
10.10 FedEx Corp.
Exhibit 119: FedEx Corp. - Overview
Exhibit 120: FedEx Corp. - Business segments
Exhibit 121: FedEx Corp. - Key offerings
Exhibit 122: FedEx Corp. - Segment focus
10.11 Kuehne Nagel International AG
Exhibit 123: Kuehne Nagel International AG - Overview
Exhibit 124: Kuehne Nagel International AG - Business segments
Exhibit 125: Kuehne Nagel International AG - Key news
Exhibit 126: Kuehne Nagel International AG - Key offerings
Exhibit 127: Kuehne Nagel International AG - Segment focus
Exhibit 128: United Parcel Service Inc. - Overview
Exhibit 129: United Parcel Service Inc. - Business segments
Exhibit 130: United Parcel Service Inc. - Key offerings
Exhibit 131: United Parcel Service Inc. - Segment focus
11.1 Scope of the report
11.2 Inclusions and exclusions checklist
Exhibit 132: Inclusions checklist
Exhibit 133: Exclusions checklist
11.3 Currency conversion rates for US$
Exhibit 134: Currency conversion rates for US$
11.4 Research methodology
Exhibit 135: Research methodology
Exhibit 136: Validation techniques employed for market sizing
Exhibit 137: Information sources
11.5 List of abbreviations
Exhibit 138: List of abbreviations
About Us
Technavio is a leading global technology research and advisory company. Their research and analysis focus on emerging market trends and provide actionable insights to help businesses identify market opportunities and develop effective strategies to optimize their market positions. With over 500 specialized analysts, Technavio's report library consists of more than 17,000 reports and counting, covering 800 technologies, spanning 50 countries. Their client base consists of enterprises of all sizes, including more than 100 Fortune 500 companies. This growing client base relies on Technavio's comprehensive coverage, extensive research, and actionable market insights to identify opportunities in existing and potential markets and assess their competitive positions within changing market scenarios.
Contact
Technavio Research
Jesse Maida
US: +1 844 364 1100
UK: +44 203 893 3200
Email: [email protected]
Website: www.technavio.com/
SOURCE Technavio
更多内容,请访问原始网站
文中所述内容并不反映新药情报库及其所属公司任何意见及观点,如有版权侵扰或错误之处,请及时联系我们,我们会在24小时内配合处理。
机构
适应症
-靶点
-药物
-来和芽仔聊天吧


立即开始免费试用!
智慧芽新药情报库是智慧芽专为生命科学人士构建的基于AI的创新药情报平台,助您全方位提升您的研发与决策效率。
立即开始数据试用!
智慧芽新药库数据也通过智慧芽数据服务平台,以API或者数据包形式对外开放,助您更加充分利用智慧芽新药情报信息。