预约演示
更新于:2025-05-15
Gadoteridol
钆特醇
更新于:2025-05-15
概要
基本信息
非在研机构- |
权益机构- |
最高研发阶段批准上市 |
首次获批日期 美国 (1992-11-16), |
最高研发阶段(中国)批准上市 |
特殊审评- |
登录后查看时间轴
结构/序列
分子式C17H29GdN4O7 |
InChIKeyDPNNNPAKRZOSMO-UHFFFAOYSA-K |
CAS号120066-54-8 |
关联
16
项与 钆特醇 相关的临床试验NCT05915702
A Multicenter, Randomized, Prospective Double-blind, Cross-over Phase 3 Study to Evaluate the Efficacy and Safety of 0.04 mmol Gd/kg Body Weight of Gadoquatrane for MRI in Adults With Known or Suspected Pathology of the Central Nervous System (CNS), Compared to 0.1 mmol Gd/kg Approved Macrocyclic Gadolinium-based Contrast Agents (GBCAs)
Researchers are looking for a better way to help people with known or suspected brain or spinal cord-related problems scheduled for a "contrast-enhanced" Magnetic Resonance Imaging (MRI).
MRI is used by doctors to create detailed images of the inside of the body to identify health problems. Sometimes doctors need to inject a contrast agent into a patient's vein to perform a so called "contrast-enhanced" MRI (CE-MRI). Such CE-MRI examinations may support doctors to identify certain health problems or improve the evaluation.
The contrast agents commonly used in MRI are gadolinium-based contrast agents (GBCAs). GBCAs contain a "rare earth" element called gadolinium (Gd). Gadoquatrane is a new contrast agent under development with a lower amount of Gd needed per CE-MRI.
The main purpose of this study is to learn whether CE-MRI scans with gadoquatrane work better than MRI scans without the use of a contrast agent (GBCA). The researchers will compare the ability to detect brain and spinal cord-related problems in gadoquatrane-MRI scans to plain-MRI scans without the use of a contrast agent.
The participants will undergo 2 MRI scans, one with gadoquatrane and one with currently used GBCA. Both contrast agents will be injected into the vein.
Each participant will be in the study for between 6 and 42 days with up to 7 doctor visits.
At the start or during the study, the doctors and their study team will:
* take blood and urine samples
* do physical examinations
* check blood pressure and heart rate
* review the MRI scans obtained in the study and decide on the diagnosis
* ask the participants questions about how they are feeling and what adverse events they are having.
An adverse event is any medical problem that a participant has during a study. Doctors keep track of all adverse events, irrespective if they think it is related or not to the study treatments.
开始日期2023-07-24 |
申办/合作机构 |
NCT05915728
A Multicenter, Randomized, Prospective Double-blind, Cross-over Phase 3 Study to Evaluate the Efficacy and Safety of 0.04 mmol Gd/kg Body Weight of Gadoquatrane for MRI in Adults With Known or Suspected Pathology of Any Body Region (Except CNS), Compared to 0.1 mmol Gd/kg Approved Macrocyclic Gadolinium-based Contrast Agents (GBCAs)
Researchers are looking for a better way to help people with any known or suspected problems (except brain or spinal cord-related problems) scheduled for a "contrast-enhanced" Magnetic Resonance Imaging (MRI).
MRI is used by doctors to create detailed images of the inside of the body to identify health problems. Sometimes doctors need to inject contrast agent into a patient's vein to perform a so called "contrast-enhanced" MRI (CE-MRI). Such CE-MRI examinations may support doctors to identify certain health problems or improve the evaluation.
The contrast agents commonly used in MRI are gadolinium-based contrast agents (GBCAs). GBCAs contain a "rare earth" element called gadolinium (Gd). Gadoquatrane is a new contrast agent under development with a lower amount of Gd needed per CE-MRI.
The main purpose of this study is to learn whether CE-MRI scans with gadoquatrane work better than MRI scans without the use of a contrast agent (GBCA). The researchers will compare the ability to detect known or suspected problems (except brain or spinal cord-related problems) with gadoquatrane-MRI scans to plain-MRI scans without the use of a contrast agent.
The participants will undergo 2 MRI scans, one with gadoquatrane and one with currently used GBCA. Both contrast agents will be injected into the vein.
Each participant will be in the study for between 6 and 42 days with up to 7 doctor visits.
At the start or during the study, the doctors and their study team will:
* take blood and urine samples
* do physical examinations
* check blood pressure and heart rate
* review the MRI scans obtained in the study and decide on the diagnosis
* ask the participants questions about how they are feeling and what adverse events they are having.
An adverse event is any medical problem that a participant has during a study. Doctors keep track of all adverse events, irrespective if they think it is related or not to the study treatments.
开始日期2023-07-24 |
申办/合作机构 |
NCT05357833
Novel Imaging Markers of Innate Immune Activation in Secondary Progressive Multiple Sclerosis
This pilot study takes the innovative approach of using ultrasmall superparamagnetic iron oxide (USPIO) nanoparticle enhanced MRI to measure activity of the innate immune system within MS lesions. Activity of innate immunity has been hypothesized as one of the critical pathologic processes underpinning neurologic worsening in progressive MS. As such, in the short term this project proposes to investigate USPIO uptake in SPMS lesions as a promising in vivo imaging biomarker for chronic-active lesions, as distinguished from chronic-inactive lesions.
开始日期2022-06-01 |
申办/合作机构 |
100 项与 钆特醇 相关的临床结果
登录后查看更多信息
100 项与 钆特醇 相关的转化医学
登录后查看更多信息
100 项与 钆特醇 相关的专利(医药)
登录后查看更多信息
618
项与 钆特醇 相关的文献(医药)2024-12-01·JOURNAL OF NEUROSURGERY
Preclinical evaluation of transaxial intraputaminal trajectory for enhanced distribution of grafted cells in Parkinson’s disease
Article
作者: Colwell, Julia C. ; Emborg, Marina E. ; Coonen, Jennifer ; Pape, Bruce ; Bondarenko, Viktoriya ; Fitz, Casey ; Fuchs, Kerri ; Hurley, Sam ; Metzger, Jeanette M. ; Larson, Paul ; Olsen, Miles ; Bratt-Leal, Andres M. ; Tran, Ha ; Schultz-Darken, Nancy ; Wirth, Edward ; Brunner, Kevin ; Mancinelli, Anthony ; Simmons, Heather A. ; Menna, Viktorie ; Zinnen, Alexandra D.
OBJECTIVE:
The objective of this study was to develop and evaluate the feasibility and safety of a novel transaxial surgical approach for the delivery of human induced pluripotent stem cell–derived dopaminergic neuroprogenitor cells (DANPCs) into the putamen nucleus using nonhuman primates and surgical techniques and tools relevant to human clinical translation.
METHODS:
Nine immunosuppressed, unlesioned adult cynomolgus macaques (4 females, 5 males) received intraputaminal injections of vehicle or DANPCs (0.9 × 10⁵ to 1.1 × 10⁵ cells/µL) under real-time intraoperative MRI guidance. The infusates were combined with 1-mM gadoteridol (for intraoperative MRI visualization) and delivered via two tracks per hemisphere (ventral and dorsal) using a transaxial approach. The total volumes of infusion were 25 µL and 50 µL for the right and left putamen, respectively (infusion rate 2.5 µL/min). Animals were evaluated with a battery of clinical and behavioral outcome measures and euthanized 7 or 30 days postsurgery; full necropsies were performed by a board-certified veterinary pathologist. Brain tissues were collected and processed for immunohistochemistry, including against the human-specific marker STEM121.
RESULTS:
The optimized surgical technique and tools produced successful targeting of the putamen via the transaxial approach. Intraoperative MR images confirmed on-target intraputaminal injections in all animals. All animals survived to scheduled termination without clinical evidence of neurological deficits. The first 4 animals to undergo surgery had mild brain swelling noted at the end of surgery, of which 3 had transient reduced vision; administration of mannitol therapy and reduced intravenous fluid during the surgical procedure addressed these complications. Immunostaining against STEM121 confirmed the presence of grafted cells along the injection track within the targeted putamen area of DANPC-treated animals. All adverse histological findings were limited in scope and consistent with surgical manipulation, injection procedure, and postsurgical inflammatory response to the mechanical disruption caused by the cannula insertion.
CONCLUSIONS:
The delivery system, injection procedure, and DANPCs were well tolerated in all animals. Prevention of mild brain swelling by mannitol dosing and reduction of intravenous fluids during surgery allowed visual effects to be avoided. The results of the study established that this novel transaxial approach can be used to correctly and safely target cell injections to the postcommissural putamen and support clinical investigation.
2024-09-01·EUROPEAN JOURNAL OF PHARMACEUTICAL SCIENCES
Taylor dispersion analysis for measurement of diffusivity and size of gadolinium-based contrast agents
Article
作者: Chamieh, Joseph ; Cottet, Hervé ; Somnin, Chutintorn ; Iglesias, Carlos Platas ; Rousseaux, Olivier ; Leclercq, Laurent ; Menedeu, Mael Le ; Medina, Christelle ; Tripier, Raphael
Gadolinium-based contrast agents (GBCA) are complexes of a Gadolinium metal center and a linear or macrocyclic polyamino-carboxylic acid chelating agent. These agents are employed to enhance the visibility of deep abnormalities through MRI techniques. Knowing the precise dimensions of various GBCA is key parameter for understanding their in-vivo and pharmaco-kinetic behaviors, their diffusivity, as well as their relaxivity. However, conventional size characterization techniques fall short when dealing with these tiny molecules (≤1 nm). In this work, we propose to determine the size and diffusivity of gadolinium-based contrast agents using Taylor dispersion analysis (TDA). TDA provided a reliable measurement of the hydrodynamic diameter and the diffusion coefficient. The obtained results were compared to DOSY NMR (Diffusion-ordered Nuclear Magnetic Resonance Spectroscopy) and DFT (Density Functional Theory).
2024-08-01·Journal of magnetic resonance imaging : JMRI
Efficacy of Whole‐Blood Model of Gadolinium‐Based Contrast Agent Relaxivity in Predicting Vascular MR Signal Intensity In Vivo
Article
作者: Kirchin, Miles A. ; Norris, Evan C. ; Schneider, Guenther ; Maki, Jeffrey H. ; Wilson, Gregory J. ; Clark, Toshimasa J.
Background:
Previous in vitro studies have described sub‐linear longitudinal and heightened transverse H2O relaxivities of gadolinium‐based contrast agents (GBCAs) in blood due to their extracellular nature. However, in vivo validation is lacking.
Purpose:
Validate theory describing blood behavior of R1 and R2* in an animal model.
Study Type:
Prospective, animal.
Animal Model:
Seven swine (54–65 kg).
Field Strength/Sequence:
1.5 T; time‐resolved 3D spoiled gradient‐recalled echo (SPGR) and quantitative Look‐Locker and multi‐echo fast field echo sequences.
Assessment:
Seven swine were each injected three times with 0.1 mmol/kg intravenous doses of one of three GBCAs: gadoteridol, gadobutrol, and gadobenate dimeglumine. Injections were randomized for rate (1, 2, and 3 mL/s) and order, during which time‐resolved aortic 3D SPGR imaging was performed concurrently with aortic blood sampling via an indwelling catheter. Time‐varying [GBCA] was measured by mass spectrometry of sampled blood. Predicted signal intensity (SI) was determined from a model incorporating sub‐linear R1 and R2* effects (whole‐blood model) and simpler models incorporating linear R1, with and without R2* effects. Predicted SIs were compared to measured aortic SI.
Statistical Tests:
Linear correlation (coefficient of determination, R2) and mean errors were compared across the SI prediction models.
Results:
There was an excellent correlation between predicted and measured SI across all injections and swine when accounting for the non‐linear dependence of R1 and high blood R2* (regression slopes 0.91–1.04, R2 ≥ 0.91). Simplified models (linear R1 with and without R2* effects) showed poorer correlation (slopes 0.67–0.85 and 0.54–0.64 respectively, both R2 ≥ 0.89) and higher averaged mean absolute and mean square errors (128.4 and 177.4 vs. 42.0, respectively, and 5506 and 11,419 vs. 699, respectively).
Data Conclusion:
Incorporating sub‐linear R1 and high first‐pass R2* effects in arterial blood models allows accurate SPGR SI prediction in an in vivo animal model, and might be utilized when modeling MR blood SI.
Level of Evidence:
1
Technical Efficacy:
Stage 1
94
项与 钆特醇 相关的新闻(医药)2025-04-20
·信狐药迅
本周药品注册受理数据,分门别类呈现,一目了然。(4.14-4.20)新药上市申请药品名称企业注册分类受理号玛硒洛沙韦片南京征祥医药有限公司1CXHS2500029卓乐替尼片北京诺诚健华医药科技有限公司1CXHS2500028布瑞哌唑口溶膜国药瑞福莱药业有限公司2.2CXHS2500031布瑞哌唑口溶膜国药瑞福莱药业有限公司2.2CXHS2500030新药临床申请药品名称企业注册分类受理号HS387片浙江海正药业股份有限公司1CXHL2500402HS387片浙江海正药业股份有限公司1CXHL2500401HS387片浙江海正药业股份有限公司1CXHL2500400BW-20507注射液上海舶望制药有限公司1CXHL2500388WBD156胶囊韦恩生物科技有限公司1CXHL2500397WBD156胶囊韦恩生物科技有限公司1CXHL2500396WBD156胶囊韦恩生物科技有限公司1CXHL2500395HSK45030分散片西藏海思科制药有限公司1CXHL2500391HSK45030分散片西藏海思科制药有限公司1CXHL2500390102D-6干混悬剂卡文迪许(泰州)药业有限公司1CXHL2500389PTT-621片北京炎明生物科技有限公司1CXHL2500399PTT-621片北京炎明生物科技有限公司1CXHL2500398KY2液体硬胶囊深圳开悦生命科技有限公司1CXHL2500387YJH-012注射液丽珠医药集团股份有限公司1CXHL2500386GD-19乳状注射液天津谷堆生物医药科技有限公司2.1CXHL2500385CX001缓释片重庆华森制药股份有限公司2.2CXHL2500394CX001缓释片重庆华森制药股份有限公司2.2CXHL2500393CX001缓释片重庆华森制药股份有限公司2.2CXHL2500392注射用HDM2020杭州中美华东制药有限公司1CXSL2500317AK2024 注射液安徽安科生物工程(集团)股份有限公司1CXSL2500318ZVS101e注射液北京中因科技有限公司1CXSL2500319J002温州医科大学1CXSL2500315J002温州医科大学1CXSL2500314YOLT-101注射液尧唐(南京)生物科技有限公司1CXSL2500313HF158K1杭州高田生物医药有限公司1CXSL2500312HFK2杭州高田生物医药有限公司1CXSL2500311SSS55注射液沈阳三生制药有限责任公司1CXSL2500310注射用HY05350四川汇宇海玥医药科技有限公司1CXSL2500316注射用HS-20093上海翰森生物医药科技有限公司1CXSL2500302注射用XNW27011上海信诺维生物医药有限公司1CXSL2500305AI-081注射液南京昂科免疫生物医药有限公司1CXSL2500304AL-001眼用注射液北京安龙合生药业有限公司1CXSL2500301SHR-4506注射液苏州盛迪亚生物医药有限公司1CXSL2500300GB261注射液上海坦蒂生物医药科技有限公司1CXSL2500299SCTB39G注射液神州细胞工程有限公司1CXSL2500307DMR2301注射液上海多米瑞生物技术有限公司1CXSL2500308SHR-2173注射液广东恒瑞医药有限公司1CXSL2500298人脐带间充质干细胞注射液源品细胞生物科技集团有限公司1CXSL2500297注射用重组A型肉毒毒素(Sf9细胞,150 kD天然氨基酸序列)苏州若弋生物科技有限公司2.4CXSL2500309仿制药申请药品名称企业注册分类受理号地氯雷他定口服溶液河南华雒康润药业有限公司3CYHS2501488坎地沙坦酯氢氯噻嗪片(Ⅱ)江苏和晨药业有限公司3CYHS2501500盐酸卡利拉嗪胶囊浙江京新药业股份有限公司3CYHS2501485盐酸卡利拉嗪胶囊浙江京新药业股份有限公司3CYHS2501484对乙酰氨基酚维生素C泡腾片上海欣峰制药有限公司3CYHS2501482硝普钠注射液广州泽盛药业科技有限公司3CYHS2501479布美他尼片中山万汉制药有限公司3CYHS2501478布美他尼片中山万汉制药有限公司3CYHS2501477镥[177Lu]氧奥曲肽注射液北京先通国际医药科技股份有限公司3CYHS2501474盐酸异丙嗪注射液江西人可医药科技有限公司3CYHS2501466盐酸异丙嗪注射液江西人可医药科技有限公司3CYHS2501465吲哚布芬片湖南千金协力药业有限公司3CYHS2501464己酮可可碱缓释片北京星昊医药股份有限公司3CYHS2501461碳酸钙片中和医药(湖北)有限公司3CYHS2501473布美他尼注射液山东辉成药业有限公司3CYHS2501471坎地氢噻片河北宏鑫堂药业有限公司3CYHS2501463复方聚乙二醇(3350)电解质散安徽四环科宝制药有限公司3CYHS2501449复方聚乙二醇(3350)电解质散安徽四环科宝制药有限公司3CYHS2501448复方电解质醋酸钠葡萄糖注射液成都欣捷高新技术开发股份有限公司3CYHS2501446复方电解质醋酸钠葡萄糖注射液成都欣捷高新技术开发股份有限公司3CYHS2501445注射用头孢噻肟钠广东粤和泽药物研究有限公司3CYHS2501443注射用头孢噻肟钠广东粤和泽药物研究有限公司3CYHS2501442注射用头孢噻肟钠广东粤和泽药物研究有限公司3CYHS2501441注射用头孢噻肟钠广东粤和泽药物研究有限公司3CYHS2501440色甘酸钠滴眼液广州瑞尔医药科技有限公司3CYHS2501439地拉罗司颗粒西安诺达信医药科技有限公司3CYHS2501457地拉罗司颗粒西安诺达信医药科技有限公司3CYHS2501455盐酸丙卡特罗吸入溶液石家庄迪斯凯威医药科技有限公司3CYHS2501431门冬氨酸钾注射液石家庄四药有限公司3CYHS2501430西甲硅油咀嚼片蓬莱诺康药业有限公司3CYHS2501429注射用氨苄西林钠山东安信制药有限公司3CYHS2501427注射用氨苄西林钠山东安信制药有限公司3CYHS2501426注射用氨苄西林钠山东安信制药有限公司3CYHS2501425盐酸甲氧氯普胺注射液湖南先施制药有限公司3CYHS2501424丙酸氟替卡松乳膏浙江致新医药科技有限公司4CYHS2501501硫酸氨基葡萄糖胶囊郑州泰丰制药有限公司4CYHS2501499蒙脱石混悬液山东华铂凯盛生物科技有限公司4CYHS2501498甲氨蝶呤注射液四川百利药业有限责任公司4CYHS2501497酒石酸溴莫尼定滴眼液亚邦医药股份有限公司4CYHS2501496他克莫司软膏湖南明瑞制药股份有限公司4CYHS2501495他克莫司软膏湖南明瑞制药股份有限公司4CYHS2501494克立硼罗软膏河北合渡药业有限公司4CYHS2501493米库氯铵注射液海南康成药业有限公司4CYHS2501492米库氯铵注射液海南康成药业有限公司4CYHS2501491小儿法罗培南钠颗粒北京诚济制药股份有限公司4CYHS2501489左卡尼汀口服溶液广东健信制药股份有限公司4CYHS2501487盐酸曲恩汀片四川科瑞德制药股份有限公司4CYHS2501490特立氟胺片苏州长征-欣凯制药有限公司4CYHS2501483缬沙坦氨氯地平片(I)石家庄市普力制药有限公司4CYHS2501481缬沙坦氢氯噻嗪片浙江金立源药业有限公司4CYHS2501480玻璃酸钠滴眼液深圳立健药业有限公司4CYHS2501476普拉洛芬滴眼液珍视明(江西)药业股份有限公司4CYHS2501475盐酸氨溴索口服溶液福建太平洋制药有限公司4CYHS2501486利奥西呱片杭州和康药业有限公司4CYHS2501470利奥西呱片杭州和康药业有限公司4CYHS2501469利奥西呱片杭州和康药业有限公司4CYHS2501468注射用醋酸西曲瑞克山东新时代药业有限公司4CYHS2501467硝酸异山梨酯注射液珠海润都制药股份有限公司4CYHS2501462枸橼酸莫沙必利片四川美大康华康药业有限公司4CYHS2501460泊沙康唑注射液河南泰丰生物科技有限公司4CYHS2501472克拉霉素缓释片浙江普利药业有限公司4CYHS2501453氟比洛芬凝胶贴膏杭州泓友医药科技有限公司4CYHS2501452乳果糖口服溶液河南泰丰生物科技有限公司4CYHS2501451西甲硅油乳剂西安安健药业有限公司4CYHS2501450蒙脱石混悬液吉林省博大伟业制药有限公司4CYHS2501447硫酸氨基葡萄糖胶囊江西仁齐制药有限公司4CYHS2501444达格列净二甲双胍缓释片(III)江苏德源药业股份有限公司4CYHS2501438布瑞哌唑片江苏恩华药业股份有限公司4CYHS2501459达格列净片海南赛立克药业有限公司4CYHS2501458达格列净片海南赛立克药业有限公司4CYHS2501456替普瑞酮胶囊湖南华纳大药厂股份有限公司4CYHS2501454乌帕替尼缓释片北京福元医药股份有限公司4CYHS2501433钆特醇注射液上海司太立制药有限公司4CYHS2501432吸入用一氧化氮佛山市科的气体化工有限公司4CYHS2501428多替拉韦钠片东北制药集团沈阳第一制药有限公司4CYHS2501437聚多卡醇注射液山东华铂凯盛生物科技有限公司4CYHS2501436甲氨蝶呤注射液海南倍特药业有限公司4CYHS2501435甲氨蝶呤注射液海南倍特药业有限公司4CYHS2501434比索洛尔氨氯地平片山东华素制药有限公司4CYHS2501423盐酸达泊西汀片山东新华制药股份有限公司4CYHS2501422盐酸特比萘芬喷雾剂保定天浩制药有限公司4CYHS2501421人纤维蛋白原南岳生物制药有限公司3.4CXSS2500045盐酸甲哌卡因注射液瑞阳制药股份有限公司3CYHL2500086达普司他片齐鲁制药(海南)有限公司3CYHL2500085达普司他片齐鲁制药(海南)有限公司3CYHL2500084达普司他片齐鲁制药(海南)有限公司3CYHL2500083达普司他片齐鲁制药(海南)有限公司3CYHL2500082格隆溴铵新斯的明注射液成都诺和晟鸿生物制药有限公司3CYHL2500080琥珀酰明胶电解质醋酸钠注射液四川太平洋药业有限责任公司4CYHL2500081KH813注射液成都康弘生物科技有限公司3.3CXSL2500303甘精胰岛素注射液亿帆医药(上海)有限公司3.3CXSL2500306进口申请药品名称企业注册分类受理号诺西那生钠注射液Biogen Netherlands B.V.2.2JXHS2500049诺西那生钠注射液Biogen Netherlands B.V.2.2JXHS2500048甲苯磺酸他拉唑帕利胶囊Pfizer Europe MA EEIG5.1JXHS2500047甲苯磺酸他拉唑帕利胶囊Pfizer Europe MA EEIG5.1JXHS2500046米吉珠单抗注射液Eli Lilly and Company3.1JXSS2500047米吉珠单抗注射液Eli Lilly and Company3.1JXSS2500046米吉珠单抗注射液Eli Lilly and Company3.1JXSS2500045注射用A型肉毒毒素inibio co., ltd.3.4JXSS2500048BMS-986435片Bristol-Myers Squibb Company1JXHL2500086BMS-986435片Bristol-Myers Squibb Company1JXHL2500085BMS-986435片Bristol-Myers Squibb Company1JXHL2500084AZD6234注射液AstraZeneca AB1JXHL2500079AZD9550注射液AstraZeneca AB1JXHL2500078AZD9550注射液AstraZeneca AB1JXHL2500077奥拉帕利片AstraZeneca AB2.4JXHL2500083奥拉帕利片AstraZeneca AB2.4JXHL2500082Seladelpar胶囊Gilead Sciences, Inc.2.4JXHL2500081Seladelpar胶囊Gilead Sciences, Inc.2.4JXHL2500080SAR442970注射液Sanofi-Aventis Recherche & Développement1JXSL2500059中药相关申请药品名称企业注册分类受理号益气活血解郁颗粒杭州鸿育医药科技有限公司1.1CXZL2500022小儿黄金止咳颗粒北京东方运嘉药业有限公司2.3CXZL2500023注:绿色字体部分为潜在首仿品种;不包含原料药、医用氧、注射用水、氯化钠或葡萄糖注射液等申请,不包含再注册、一次性进口、技术转移、复审申请。
申请上市临床申请
2025-03-28
·微信
精彩内容近日,正大天晴的1类新药注射用TQB2101、TQB2210注射液获批临床,公司创新药管线进展不断。2024年至今,正大天晴已有6款创新产品、10款仿制药获批上市。除了已上市的8款创新药,公司还有85款1类新药处于申报临床及以上阶段,12款处于NDA或Ⅲ期临床阶段;12款高端创新药物在研,4款上市可期;71个品种过评(23个首家),8个备战第十一批集采。1类新药进展不断!拿下16个重磅品种近日,正大天晴的1类新药注射用TQB2101(治疗晚期恶性肿瘤)、TQB2210注射液(治疗晚期恶性肿瘤)、注射用TQB2934(治疗轻链型淀粉样变)相继获得临床试验默示许可。其中,TQB2210是一款靶向FGFR2b的人源化单克隆抗体,全球尚未有同靶点药物上市。今年以来,正大天晴创新药管线进展不断,已有10款1类新药申报IND、4款1类新药获批临床。2024年至今,正大天晴研发管线持续推进,1类新药、生物类似药、仿制药获批上市的消息不断,进一步丰富公司的产品种类,拓展公司的产品布局。1类新药注册许可方面,正大天晴有4款1类新药富马酸安奈克替尼胶囊(治疗ROS1阳性非小细胞肺癌)、贝莫苏拜单抗注射液(治疗一线小细胞肺癌、子宫内膜癌)、枸橼酸依奉阿克胶囊(治疗ALK阳性非小细胞肺癌)、格索雷塞片(治疗二线KRAS G12C非小细胞肺癌)相继获批上市。其中,安奈克替尼、依奉阿克获纳入2024版医保目录。目前,公司累计已有8款1类新药获批上市。2024年至今正大天晴获批产品生物类似药注册许可方面,正大天晴的利拉鲁肽注射液(治疗2型糖尿病)、帕妥珠单抗注射液(治疗HER2乳腺癌)先后获批上市。其中,利拉鲁肽注射液为国产第3家,帕妥珠单抗注射液为国产第2家。目前,正大天晴累计已有7款生物类似药获批上市。仿制药注册许可方面,正大天晴有10个品种获批上市并视同过评,包括艾曲泊帕乙醇胺片、注射用磷酸特地唑胺、碘普罗胺注射液、钆特醇注射液、比卡鲁胺片、恩曲他滨丙酚替诺福韦片(II)、甲磺酸艾立布林注射液、注射用紫杉醇(白蛋白结合型)、艾地骨化醇软胶囊、注射用头孢他啶阿维巴坦钠。10个品种中,艾曲泊帕乙醇胺片为国内首仿,碘普罗胺注射液、钆特醇注射液为国产第2家,甲磺酸艾立布林注射液为国产第3家。85款1类新药霸屏!12款上市可期除了已获批上市的8款1类新药,目前正大天晴还有85款1类新药处于申报临床及以上研发阶段,创新研发项目处于行业前列。其中,小分子化学创新药有60个、大分子生物创新药有25个,涉及肿瘤、肝病、呼吸、代谢、自免等疾病领域,覆盖融合蛋白、单抗、双抗、ADC等药物形式。公司创新药管线蓄势待发!85款1类新药中,库莫西利胶囊(CDK2/4/6抑制剂)、TQ05105片(JAK/ROCK抑制剂)、宗格替尼片(口服HER2抑制剂)上市申请在审中,最快有望于2025年内获批上市;注射用TQB2102(HER2双抗ADC)、TQB3823片(PARP抑制剂)、AL2846胶囊(c-Met抑制剂)、TQB3454片(IDH-1抑制剂)等9款1类新药已处于Ⅲ期临床阶段,上市可期。正大天晴主要在研1类新药此外,正大天晴还有12款高端创新制剂处于申报临床及以上阶段,涉及7款生物类似药、4款改良型化药及一款血液制品。其中,注射用重组人凝血因子Ⅶa(治疗血友病)上市申请在审中,有望于2025年内获批上市;多聚糖超顺磁氧化铁注射液(治疗缺铁性贫血)、德谷胰岛素注射液(治疗2型糖尿病)、司美格鲁肽注射液(治疗2型糖尿病、体重控制)已处于Ⅲ期临床阶段,上市可期。值得一提的是,正大天晴是港股上市公司中国生物制药的核心子公司。3月20日,中国生物制药发布2024年业绩,公司全年营收达288.7亿元,同比增长10.2%,创历史新高;经调整归母净利润达34.6亿元,同比增长33.5%。作为传统药企转型创新的标杆,中国生物制药2024年创新产品收入达120.6亿元,增长21.9%,创新产品占总收入比例达到41.8%。得益于“自研+BD”的双轮驱动,中国生物制药预计未来三年将进入创新成果收获的爆发期,近20款创新产品有望获批上市,涵盖双抗、ADC等前沿疗法。预计到2027年,公司创新产品数量将突破30个,将实现收入结构的持续优化,实现业绩稳健、高质量增长。71个品种过评,8个备战第十一批集采仿制药业务方面,目前正大天晴已有71个品种通过/视同通过一致性评价,其中23个品种为国内首家过评。在国家已开展的九批化药集采中,正大天晴无一缺席,累计有30个品种中标。正大天晴通过/视同通过一致性评价品种71个过评品种涵盖10个治疗大类,主要集中在抗肿瘤和免疫调节剂(23个)、全身用抗感染药物(15个)、消化系统及代谢药(14个)。米内网数据显示,2023年中国城市公立医院、县级公立医院、城市社区中心以及乡镇卫生院(简称中国公立医疗机构)终端抗肿瘤和免疫调节剂、全身用抗感染药物、消化系统及代谢药的销售额均超过1500亿元。在研仿制药方面,正大天晴还有13个品种上市申请在审,获批生产后将视同过评。其中,6个品种酒石酸阿福特罗雾化吸入溶液、盐酸帕洛诺司琼软胶囊、乌美溴铵维兰特罗吸入粉雾剂、注射用卡非佐米、奥贝胆酸片、注射用醋酸地加瑞克在国内暂无仿制药获批上市,正大天晴将与多家企业竞争国内首仿。第十一批集采拟于2025年上半年开展,正大天晴已有8个品种符合申报资格企业数达7家及以上,包括碘普罗胺注射液、沙库巴曲缬沙坦钠片、注射用头孢他啶阿维巴坦钠(4:1)、恩曲他滨丙酚替诺福韦片(Ⅱ)、艾曲泊帕乙醇胺片、注射用丁二磺酸腺苷蛋氨酸、索磷布韦片、注射用福沙匹坦双葡甲胺。8个品种中,沙库巴曲缬沙坦钠片2023年在中国公立医疗机构终端销售额超过30亿元、碘普罗胺注射液销售额超过16亿元,注射用头孢他啶阿维巴坦钠(4:1)销售额超过10亿元。正大天晴这3个品种分别在2023年、2024年、2025年获批上市,可借助集采中标迅速抢占市场。资料来源:米内网数据库、公司公告注:米内网《中国公立医疗机构药品终端竞争格局》,统计范围是:中国城市公立医院、县级公立医院、城市社区中心以及乡镇卫生院,不含民营医院、私人诊所、村卫生室;上述销售额以产品在终端的平均零售价计算。免责声明:本文仅作医药信息传播分享,并不构成投资或决策建议。本文为原创稿件,转载文章或引用数据请注明来源和作者,否则将追究侵权责任。投稿及报料请发邮件到872470254@qq.com稿件要求详询米内微信首页菜单栏商务及内容合作可联系QQ:412539092【分享、点赞、在看】点一点不失联哦
上市批准生物类似药临床3期
2025-03-05
普利制药美国客户与GPO Premier, Inc. 达成造影剂实质性战略合作
近日,普利制药的合作伙伴Slate Run Pharmaceuticals,与美国头部GPO Premier, Inc. 达成造影剂实质性战略合作。根据合作协议,Premier GPO 的成员可自行使用Premier预先签订的价格和条款来采购碘帕醇注射液、钆布醇注射液、钆特酸葡胺注射液和钆特醇注射液。普利制药预期未来可获得10%以上的市场份额,后续将拓展至更多造影剂品种。
普利制药碘帕醇注射液美国ANDA(1)
普利制药碘帕醇注射液美国ANDA(2)
普利制药钆布醇美国ANDA
普利制药钆特酸葡胺美国ANDA
普利制药钆特醇美国ANDA
1
美国GPO
美国GPO(Group Purchasing Organization,药品集中采购组织)是一个将各种医疗机构或其他医疗服务提供者的购买需求进行集中的组织,它利用组织内部成员的集体购买力,通过与供应商谈判以帮助各成员寻求更低的购买价格和折扣。
与国内充分竞争的情况不同,美国造影剂市场准入门槛高,竞争格局好。目前,在美国碘帕醇注射液市场上普利制药是唯一一家供货的仿制药企业。普利制药的钆特醇注射液是美国首家且目前唯一获批的仿制药。此外,钆布醇注射液市场仅有3家(含原研),钆特酸葡胺注射液仅有4家(含原研)参与竞争。此次与美国头部GPO的合作,预期未来可以迅速打开美国的造影剂市场。
FDA官网显示:美国碘帕醇注射液市场上普利制药是唯一一家供货的仿制药企业
FDA官网显示:普利制药的钆特醇注射液是美国首家且目前唯一获批的仿制药
3
普利制药
在普利制药的国际化布局中,造影剂是一个重点业务领域。普利制药拥有包含钆特酸葡胺、钆特醇、钆布醇、碘帕醇、碘佛醇等多个成品制剂,并且采用原料制剂一体化策略,进行全球注册和销售,已经达成碘帕醇注射液、钆特酸葡胺注射液、钆布醇注射液、钆特醇注射液的美国获批和钆布醇注射液的荷兰获批;实现碘帕醇注射液、钆特酸葡胺注射液的中国获批。
未来,普利制药将一如既往地以“先进高端制造,面向国际和国内双循环”的战略,持续不断地推出更多更好的药物供应全球,为患者提供高品质的药物。
欢迎有兴趣海外拓展的同行,抱团出海!
业务联系人:周先生
邮箱:zm@hnpoly.com
诚邀国际开拓的精英加盟,欢迎联系HR凌女士!
hnpolyhr@hnpoly.com
医药出海上市批准
100 项与 钆特醇 相关的药物交易
登录后查看更多信息
研发状态
10 条最早获批的记录, 后查看更多信息
登录
| 适应症 | 国家/地区 | 公司 | 日期 |
|---|---|---|---|
| 造影剂 | 日本 | 1996-03-14 | |
| 造影剂 | 日本 | 1996-03-14 | |
| 可见病灶 | 美国 | 1992-11-16 |
登录后查看更多信息
临床结果
临床结果
适应症
分期
评价
查看全部结果
| 研究 | 分期 | 人群特征 | 评价人数 | 分组 | 结果 | 评价 | 发布日期 |
|---|
No Data | |||||||
登录后查看更多信息
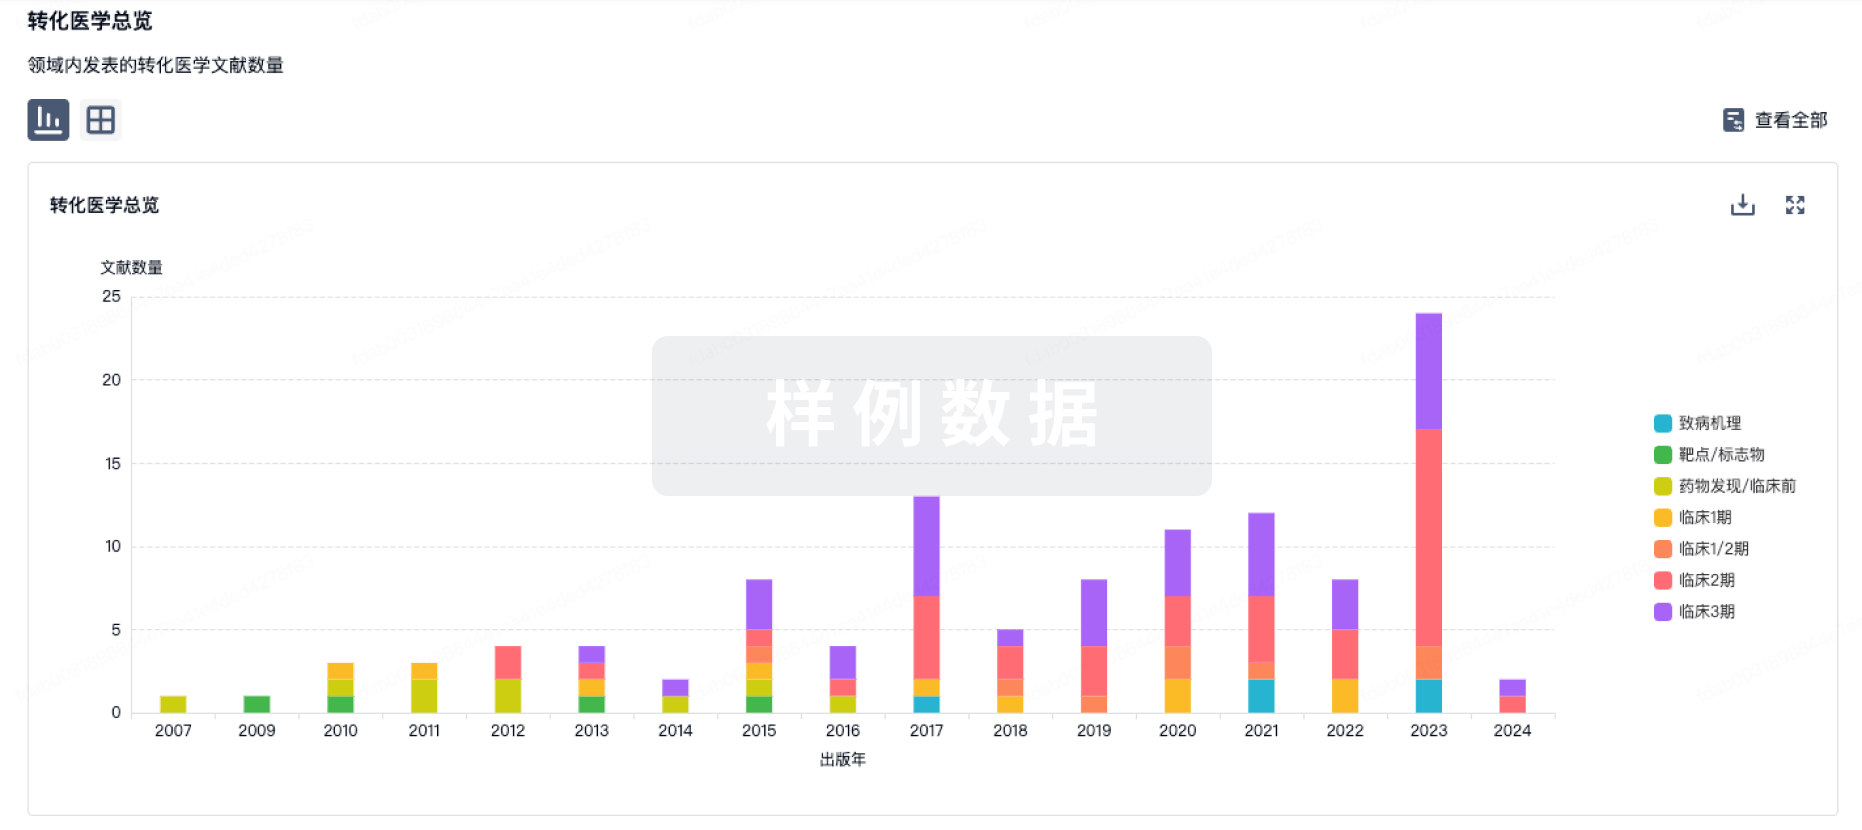
转化医学
使用我们的转化医学数据加速您的研究。
登录
或
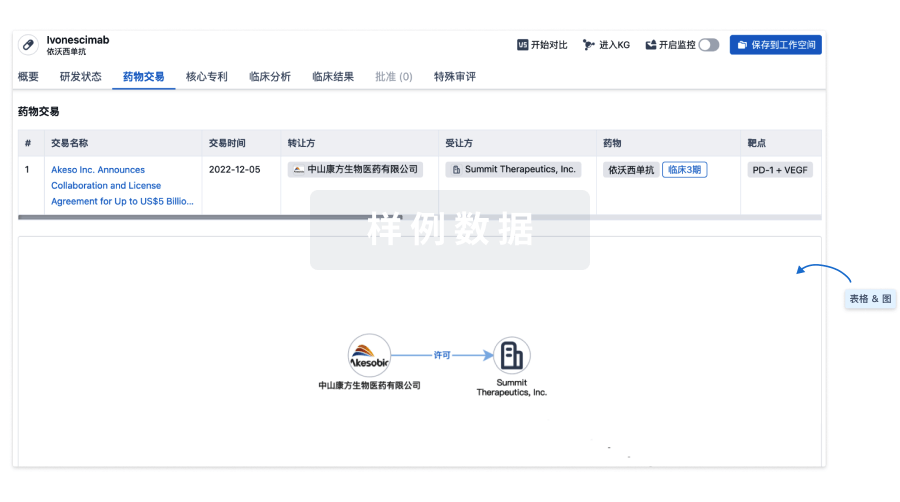
药物交易
使用我们的药物交易数据加速您的研究。
登录
或
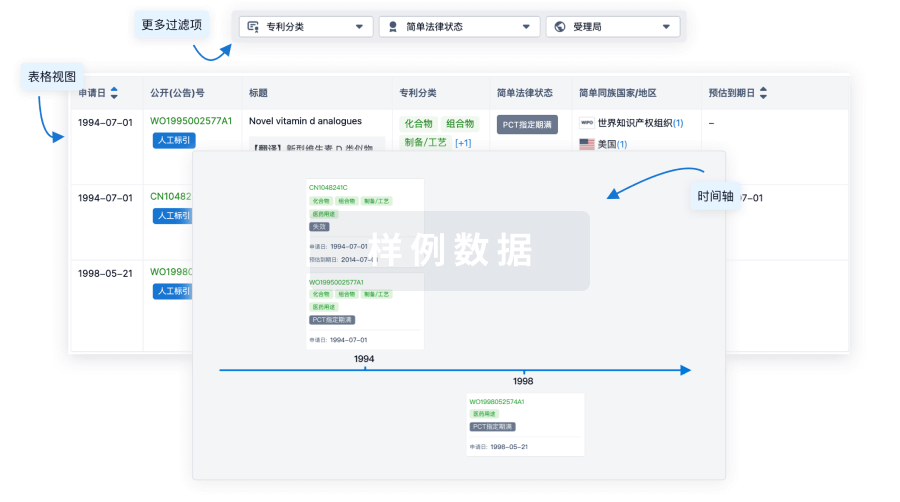
核心专利
使用我们的核心专利数据促进您的研究。
登录
或
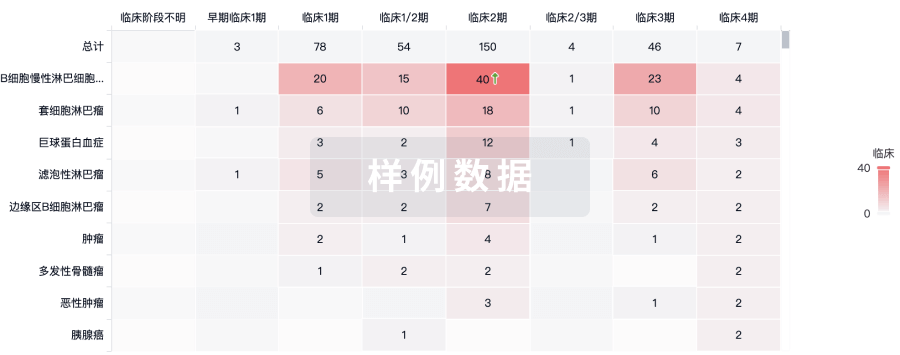
临床分析
紧跟全球注册中心的最新临床试验。
登录
或
批准
利用最新的监管批准信息加速您的研究。
登录
或
特殊审评
只需点击几下即可了解关键药物信息。
登录
或
Eureka LS:
全新生物医药AI Agent 覆盖科研全链路,让突破性发现快人一步
立即开始免费试用!
智慧芽新药情报库是智慧芽专为生命科学人士构建的基于AI的创新药情报平台,助您全方位提升您的研发与决策效率。
立即开始数据试用!
智慧芽新药库数据也通过智慧芽数据服务平台,以API或者数据包形式对外开放,助您更加充分利用智慧芽新药情报信息。
生物序列数据库
生物药研发创新
免费使用
化学结构数据库
小分子化药研发创新
免费使用


